Chapter 25 — Volatility: what ATR really tells you
If position sizing is the single most important thing a trader does, then Average True Range — ATR — is the single most important number a trader watches to do it correctly. ATR is not glamorous. It does not predict direction. It does not generate entry signals. What it does is tell you, in real time, how much gold moves on a typical day in the current regime. And that single number is what every other risk management decision should be built on.
This chapter is about ATR — how it is calculated, what it actually measures, and how to use it to size positions, set stops, and recognize volatility regimes that the chart structure alone does not reveal.
What ATR is
True Range, for any given period, is the largest of three values:
- Today's high minus today's low
- Absolute value of today's high minus yesterday's close
- Absolute value of today's low minus yesterday's close
The third measure captures gaps. If gold gaps up overnight from $2,500 to $2,520, then trades intraday between $2,515 and $2,530, the daily high-low is $15 but the gap-adjusted True Range is $30. ATR includes the overnight gap as part of the day's true volatility.
Average True Range is the moving average of True Range over a specified number of periods, typically 14. So the 14-day ATR for gold on a daily chart is the average of the past 14 days' True Ranges. It is a single number, in price units, that tells you the typical daily range.
For gold in mid-2026, the daily ATR is approximately $30-40 — meaning the typical day sees roughly $30-40 of price movement from low to high. A year ago this was closer to $20-25. Five years ago it was $15-20. ATR has expanded as the underlying price has risen.
What ATR tells you that the chart does not
The chart shows you the shape of price movement. ATR shows you the typical magnitude. These are different pieces of information and both matter for trading.
Two markets can look identical on the chart — same patterns, same levels, same trend — but if one has ATR of $30 and the other has ATR of $15, they should be traded completely differently. The high-ATR market requires wider stops, smaller position sizes, and more patience for moves to resolve. The low-ATR market allows tighter stops, larger positions, and faster execution.
Most traders eyeball volatility from the chart. The eyeball is unreliable, especially during regime transitions. A market that has been quiet for weeks and is now starting to expand looks "the same" on the chart for several days before the volatility expansion becomes visible. ATR captures the regime change earlier than visual chart reading does.
Position sizing by ATR
The most useful application of ATR is in position sizing. The principle:
Position size = (Account risk per trade) / (Stop distance in ATR units × ATR value × per-pip dollar value)
In English: you decide how much you are willing to risk on this trade (e.g., 1% of capital). You decide where your stop is, expressed in ATRs (e.g., 1.5 ATR below entry). You combine these to determine how many lots/contracts to trade.
A worked example. Account is $50,000. Risk per trade is 1% = $500. ATR on daily gold is $35. Stop is 1.5 ATR below entry, so stop distance is $52.50. Each lot of XAUUSD typically has a $1 P&L per $1 of price movement per ounce. So a $52.50 stop on 1 lot = $5,250 risk, far more than the $500 budget.
The math says: $500 / $52.50 = 9.5 ounces. Trade 0.10 of a standard lot (since one standard lot is 100 ounces and you can typically size to 0.01 increments).
This is the discipline. The position size emerges from the ATR-based stop and the account risk budget, not from "how confident am I in this trade." Confidence does not size positions. The math does.
Stops by ATR
The other key ATR application is stop placement.
Stops based on fixed percentages (e.g., always 2% below entry) ignore volatility regime. In a low-volatility regime, a 2% stop is far outside the typical noise — the stop will never get hit, but the position is small (because the stop is wide). In a high-volatility regime, a 2% stop is inside normal noise — the stop will get hit on routine intraday fluctuation, even though the trade thesis is intact.
Stops based on ATR adapt to volatility regime automatically. A 1.5 ATR stop is always 1.5 times the typical daily range away. In a quiet market, this is a tight stop. In a volatile market, this is a wide stop. Either way, it is calibrated to the actual current noise level.
For different trading styles:
- Scalpers (intraday, multi-trade): use 0.5-1.0 ATR stops on the relevant intraday timeframe.
- Day traders (one trade per day, in and out same day): use 1.0-1.5 daily ATR stops.
- Swing traders (multi-day holds): use 1.5-2.5 daily ATR stops.
- Position traders (multi-week holds): use 2.5-4.0 daily ATR stops, or move to weekly ATR.
These are rough ranges, not hard rules. The discipline is to express stops in ATR units rather than dollar amounts so they adapt automatically as regime changes.
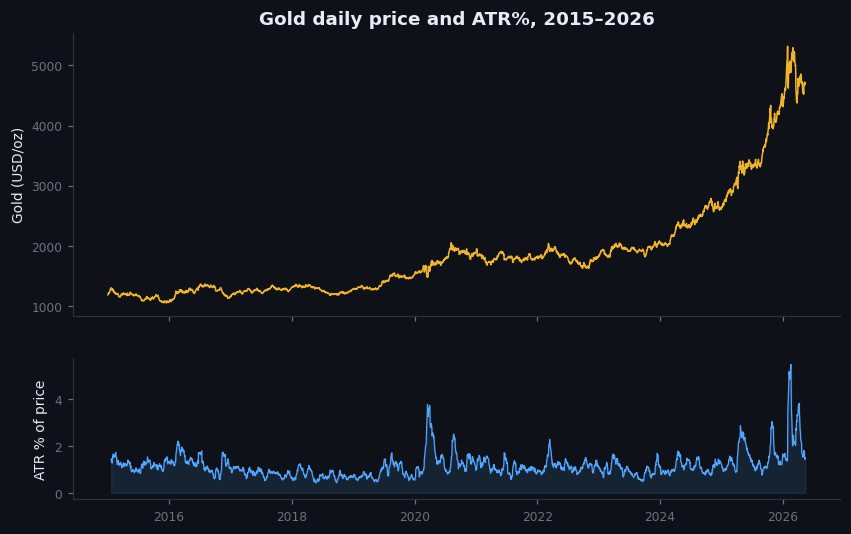
Figure 25.1 — Daily ATR for gold, 2015–2026
Line chart. 14-day ATR for gold on a daily chart, 2015 to present. Visible: gradual increase over time as gold's price rose (an absolute-dollar ATR scales with the underlying price). Spikes during high-volatility periods: March 2020 (COVID), August 2024 (yen carry unwind), late 2025 (various events). Annotation explaining the regime expansion.
Volatility regimes
Beyond using ATR for stops and sizing, the level of ATR itself signals regime:
- Low-vol regimes (ATR well below its 6-month average): typically range-bound conditions. Mean reversion strategies tend to work. Breakouts often fail. Position sizes can be larger; stops can be tighter; expected duration of trades is longer.
- High-vol regimes (ATR well above its 6-month average): typically trending or event-driven conditions. Breakouts and trend-following work. Mean reversion gets stopped out. Position sizes need to be smaller; stops need to be wider; expected duration of trades is shorter.
A useful indicator: ATR as a percentage of price. In normal regimes, daily ATR is roughly 1-1.5% of the gold price. When this ratio rises above 2%, you are in elevated vol. Above 3% is crisis-level vol. Below 0.7% is unusually quiet, which historically precedes vol expansion (the calm before the storm).
Tracking ATR-percent-of-price weekly is a simple discipline that catches regime transitions before the chart reveals them.
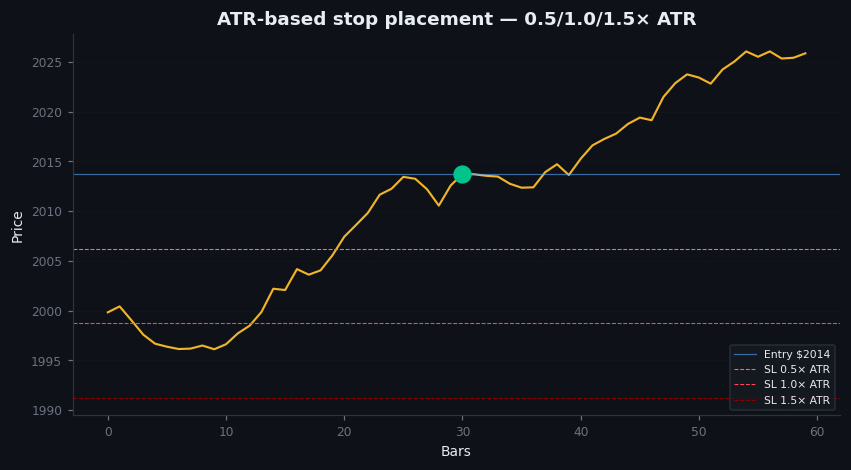
Figure 25.2 — ATR-based stop placement examples
Two side-by-side charts of gold daily price. Left: a low-vol period with ATR around $18 and a 1.5 ATR stop visible as a narrow band ($27 from entry). Right: a high-vol period with ATR around $50 and a 1.5 ATR stop visible as a wider band ($75 from entry). Same number of ATRs, same risk-adjusted exposure, but the absolute dollar stop is very different in each regime.
Illustrative — schematic stop-placement example.
On goldintel today
The dashboard's Technical Indicators panel includes ATR among the indicators surfaced from the TVRemix feed. This is useful as a quick reference but should be supplemented with your own ATR-based discipline:
- Note today's ATR.
- Compare to the 6-month average.
- Confirm whether you are in low-vol or high-vol regime.
- Size positions and place stops accordingly.
This takes 30 seconds and saves more capital than almost any other discipline available to a discretionary trader.
Common mistakes
- "Use a fixed-dollar stop ($25 below entry)." This ignores volatility regime. In a $50 ATR environment, $25 is well inside noise. In a $15 ATR environment, $25 is unnecessarily wide.
- "Trade the same size regardless of volatility." Same dollar size in different vol regimes means very different risk per trade. The discipline is to keep risk per trade constant, which requires adjusting position size to volatility.
- "ATR predicts direction." It does not. ATR measures magnitude, not direction. A high ATR can occur in any direction; a low ATR can occur during accumulation or distribution.
- "I'll just look at the chart to estimate volatility." The chart is unreliable for volatility estimation. Use the number.
Key takeaway
ATR is the normalization variable. Stops and position sizes should be expressed in ATR units, not fixed dollar amounts. ATR also signals volatility regime — track it weekly to catch regime transitions before the chart does.
Further reading:
- J. Welles Wilder, New Concepts in Technical Trading Systems — the original ATR paper.
- Ed Seykota, various interviews in Schwager's Market Wizards on volatility-adjusted position sizing.
- For systematic implementation: AHL, Man Group, and other CTAs have published methodology papers on ATR-based position sizing that are publicly accessible.
Quick reference
| ATR % of price | Regime | Tactical implication |
|---|---|---|
| < 0.8% | Compression | Breakout setup; widen targets after move |
| 0.8% – 1.5% | Normal | Standard sizing |
| 1.5% – 2.5% | Elevated | Reduce size, widen stops |
| 2.5% – 4% | High volatility | Half size; avoid mean-reversion plays |
| > 4% | Extreme | Trade only with clear regime read |