Chapter 2 — The five gold buyers
In November 2024 the People's Bank of China resumed buying gold for the first time in six months. The reported figure was 5 tonnes that month, then 10, then 12, then quieter again. By itself this is nothing — a rounding error against a market that trades roughly 600 tonnes worth of paper claims every day. But the announcement, on the published PBoC reserve data, was enough to move gold $90 over the following two weeks.
For a Western trader watching Fed dot plots and CPI prints, that move came from nowhere. For anyone who watches central bank reserve flows, it was the obvious play.
Gold has five buyers. They want different things. They behave differently. They are sensitive to different inputs. And in any given month, one of them is sitting at the margin — moving the price more than the others — while the rest are mostly noise. The job is knowing which one is at the margin this month.
Buyer one — Jewelry
The largest gold buyer in the world is, by a wide margin, the jewelry consumer. About half of all gold demand in any given year, measured in tonnes, is jewelry. The two countries that matter are India and China, which between them account for roughly 60% of global jewelry demand.
This buyer is price-sensitive and seasonal. When the gold price rises sharply, Indian wedding-season demand falls. When the price stabilizes at a higher level for a few months, demand recovers as buyers adjust their expectations. The annual pattern, year after year, is a Q4 spike for Indian Diwali and the Chinese New Year run-up, then softness in Q1, then a recovery through summer.
Jewelry buyers do not move the gold price in the short term. They are too price-sensitive — they back off when price moves against them. But they do set the floor under the long-term gold price. Below a certain level, jewelry demand swamps any selling pressure, and the floor holds. That floor moved up roughly $300 per ounce during 2022 to 2025 as Asian per-capita incomes rose. It is the quietest and most important buyer in the market.
Buyer two — Central banks
Until 2008, central banks were net sellers of gold. The European agreements of 1999 and 2004 explicitly coordinated the sale of European reserves into the market — partly to fund modernization, partly because gold was seen as an obsolete reserve asset in a fiat-dominant world. The price of gold in that period traded between $250 and $1,000, and the steady drip of central bank selling was a structural headwind.
Since 2009, central banks have been net buyers. Since 2022 they have been net buyers at a pace that has no historical precedent in the post-Bretton-Woods era — roughly 1,000 tonnes per year, or about a quarter of new mine supply. The buyers are not the Western central banks (the Fed, ECB, BoJ — they hold their existing reserves and rarely transact). The buyers are emerging-market central banks: China, Turkey, India, Poland, Singapore, the Gulf states, and a long tail of others.
The motivation, in plain language, is reserve diversification away from US dollar exposure. The 2022 freezing of Russian central bank dollar reserves after the Ukraine invasion was the explicit catalyst. Every other non-aligned central bank looked at that and concluded: dollar reserves can be confiscated by political decision; gold reserves cannot. The structural buying has continued at this pace for four years and shows no sign of reversing.
This buyer is insensitive to price on monthly timeframes and very sensitive to political shifts on multi-year timeframes. Central banks do not chase rallies, but they do not stop buying because gold is expensive. They have a target allocation (typically rising from 5% of reserves toward 15-25% for the EM buyers) and they buy steadily toward it. The PBoC, the largest single buyer, announces its purchases at month-end. The market watches these announcements like Fed minutes.
Buyer three — Investors (ETFs and bars/coins)
The third buyer is the Western investor. This buyer holds gold through ETFs (GLD, IAU, SPDR Gold MiniShares, the European equivalents) or as physical bars and coins purchased from dealers.
Unlike jewelry and central banks, this buyer is sentiment-driven. Western ETF flows track Western risk-off sentiment, US real yields, and dollar strength. ETF holdings can swing by 500 tonnes in a year in either direction — bigger than the entire central bank net purchase figure — but the swings are bidirectional. ETF buyers chase rallies and sell off declines. They are the marginal buyer in a rising market and the marginal seller in a falling one.
For a trader, ETF flows are the most useful single demand signal because they are reported daily and they have the highest correlation with short-term price moves. The 2013 ETF unwind, mentioned in the previous chapter, drove gold from $1,693 to $1,180 in six months. The 2020 ETF buying spree drove gold from $1,500 to $2,089 in five months. ETF flows are a sentiment thermometer dressed as a demand indicator.
Buyer four — Industrial
The smallest meaningful buyer, at roughly 10% of demand, is industrial — primarily electronics (gold's conductivity is unmatched for some semiconductor applications), and a small fraction in dentistry, aerospace, and chemistry.
Industrial demand is very stable and price-insensitive in the short run. Electronics manufacturers cannot substitute gold easily in the applications where they use it, so they buy what they need and absorb the price. This buyer matters only in the sense that it is the slice of demand that is consumed — actually destroyed, embedded in products that get discarded and rarely recycled. Every other buyer recycles eventually. Industrial demand is the only true sink.
For a trader, industrial demand is background noise. It almost never moves price on any timeframe relevant to trading.
Buyer five — The other one
There is a fifth buyer that the World Gold Council does not publish detailed figures on, because the figures cannot be reliably measured. This is the unreported buyer: sanctions evasion, illicit cross-border flows, hoarding by individuals in countries with capital controls or unstable currencies, and the long tail of unregistered demand from family offices, sovereign wealth funds, and quasi-state actors who prefer not to be in the WGC tables.
How big is this buyer? Nobody knows. Estimates put it between 5% and 15% of total demand, with the upper end of that range concentrated in three geographies — Turkey, Iran, and Venezuela in recent years, plus a structural component in India that bypasses official import channels.
This buyer matters less for its size and more for the information it carries. When unreported demand spikes — visible through customs anomalies, gold premium widening in regional markets like Dubai or Istanbul, or unusual physical flows — it is usually a signal of capital-control tightening, currency stress, or geopolitical pressure. A trader who watches the regional gold premium in Istanbul or Mumbai is, in effect, watching the fifth buyer in real time.
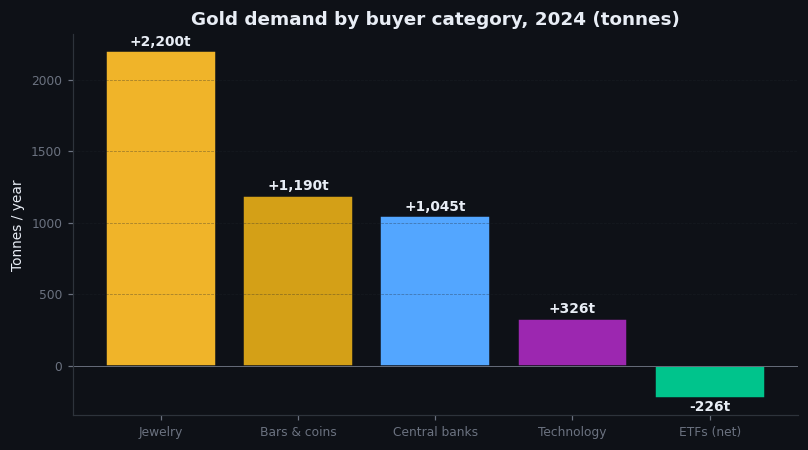
Figure 2.1 — Annual gold demand by buyer category, 2024
Pie chart. Jewelry 47%, Central banks 21%, ETFs and investment bars/coins 18%, Industrial 10%, Unreported (estimated) 4%. Source: World Gold Council Gold Demand Trends, full-year 2024 figures. Numbers approximate; rebalance to actual when generating final chart.
Illustrative — WGC 2024 published values, presented as bar chart.
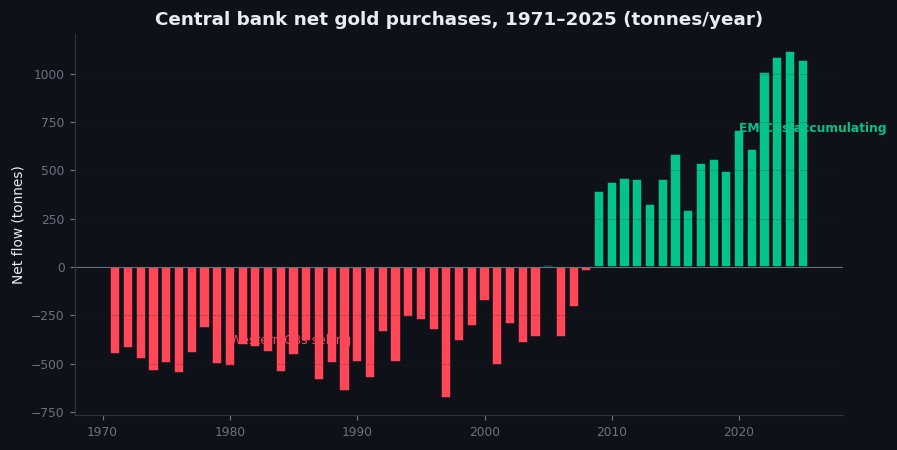
Figure 2.2 — Central bank net purchases, 1971–2025
Bar chart. Annual net central bank flow, in tonnes, from 1971 through 2025. Bars are red for net selling (1971–1979, 1989–2008 with a few exceptions), green for net buying (2009 onward). Visible regime change in 2009 from net seller to net buyer. Annotation arrows for 1999 European agreement, 2008 Washington reversal, 2022 Russia reserve freeze, 2024 PBoC resumption.
Illustrative — illustrative — annual CB flows calibrated to WGC history.
Why this matters for a trader
Most traders treat "gold demand" as one thing. That treatment is the mistake.
At any given moment, one of these five buyers is the marginal one. Their behavior is what determines next-month price action. The other four are mostly steady. If you can identify which one is at the margin this month, you have an information edge that no chart-based analysis can match.
Quick examples:
- Q4 2024: Central banks (PBoC resumed buying) and ETFs (Western risk-off after election). Two simultaneous marginal buyers. Result: gold rallied 22% in three months.
- Q1 2013: ETFs (massive Western outflows on tapering fears) at the margin while jewelry tried to absorb the bars being released. Result: gold fell 30% in two quarters; ETFs won the price-discovery fight.
- Q3 2022: Central banks (post-Ukraine-invasion EM buying) and jewelry (Asian price-stabilization buying) at the margin against Western ETF selling. Two stable buyers vs one sentiment-driven seller. Result: gold held its $1,650 floor and started the rally that took it to $2,000.
- August 2020: ETFs (peak COVID risk-off) at the margin, jewelry weak (Asia in lockdown), central banks quiet. Single-buyer-driven rally. Result: gold spiked to $2,089, then immediately faded $200 when ETF inflows slowed.
The pattern: when multiple buyer categories are aligned in the same direction, moves are durable. When only one buyer category is driving — especially when it is ETFs — moves tend to reverse quickly.
On goldintel today
The dashboard does not yet break demand down by buyer category — this is a known gap that I will close. For now, the closest proxy is the Market Drivers panel, which surfaces DXY and US10Y (the variables Western ETF buyers care about). The PBoC reserve update is reported in the news feed when it lands (usually first week of each month); look for headlines tagged "central bank" or "PBoC."
If you want to track central bank buying independently, the World Gold Council's quarterly Gold Demand Trends report is the only comprehensive source. ETF flows are tracked daily at the WGC's Gold ETF Holdings page and at the SPDR Gold Trust's own daily NAV postings.
Common mistakes
- "ETF flows drive the gold price." They drive it on short timeframes — days to weeks. They are dwarfed in any given year by jewelry plus central bank demand, but those are stable and don't move price. ETFs are the marginal sentiment-driven flow that sets short-term direction. Confusing marginal with dominant is the error.
- "Central banks always buy." Before 2008, they were net sellers for two decades. The current buying regime began in 2009 and accelerated after 2022. It is a regime, not a constant.
- "Jewelry is uneconomic." Jewelry demand is the largest single demand category by tonnage. It is also the most stable. Calling it uneconomic is treating it like investment demand, which it isn't.
- "Industrial gold is the floor." It isn't — industrial demand is ~10% and inelastic. Jewelry demand is what actually anchors the long-term floor in any major bear market.
Key takeaway
Gold has five buyers. The one at the margin in any given month drives the price; the others are background. Knowing which is which is half the edge.
Further reading:
- World Gold Council, Gold Demand Trends — quarterly, the canonical source. Free at gold.org.
- Metals Focus, Gold Focus annual report.
- Lawrence Williams, various columns on central bank gold buying at Sharps Pixley and Mining.com.
- PBoC monthly reserve data — published in the first week of each month on the People's Bank of China website.
Quick reference
| Buyer category | Share of demand | Behavior | Price-sensitivity |
|---|---|---|---|
| Jewelry | ~50% | Seasonal/cultural | High (cuts buying at peaks) |
| Investment | ~25% | Cyclical | High (chases trends) |
| Central banks | ~20% | Strategic | None (price-insensitive) |
| Technology | ~5% | Steady | Low (small share) |
| ETFs (subset) | within Invt. | Sentiment-driven | High (fast in / fast out) |