Chapter 11 — Real yields: the master variable
If you were going to watch one chart, and only one chart, to predict the direction of gold over the next three to twelve months, it would not be a chart of gold.
It would be a chart of the US 10-year Treasury Inflation-Protected Security (TIPS) yield.
For more than 25 years, the relationship between gold and the 10-year TIPS yield has been the most reliable single-variable predictor of gold's direction. The correlation runs at roughly -0.7 to -0.9 across most periods, meaning: when real yields fall, gold rises. When real yields rise, gold falls. The relationship is mechanical, intuitive once you understand it, and — when it breaks down, as it has in parts of 2024-2026 — the breakdown itself is informative.
This chapter is the most important in the macro engine. Read it twice.
What a real yield actually is
When you buy a 10-year US Treasury, the yield it pays is a nominal yield. Today, that nominal yield might be 4.5%. But the dollars you receive in coupon payments will be worth less, in real purchasing power, by the time you receive them — because inflation will have eroded the dollar between now and then.
The real yield is the nominal yield minus expected inflation. If 10-year Treasuries yield 4.5% and the market's best estimate of 10-year average inflation is 3.0%, the real yield is roughly 1.5%. You will earn 1.5% per year in real purchasing power, on average, over the life of the bond.
The cleanest market measure of expected inflation is the breakeven inflation rate — the difference between nominal 10-year Treasury yields and 10-year TIPS yields. TIPS pay a yield indexed to actual CPI, so their quoted yield is the real yield directly. You can read it off the chart. No subtraction needed.
The TIPS market only opened in 1997, so for pre-1997 analysis you have to estimate real yields using nominal yields minus survey-based inflation expectations (the Michigan or Philadelphia Fed surveys). The estimates are good enough for regime analysis but not for precision tactical work.
Why real yields drive gold
Gold pays no yield. Holding gold for one year produces zero cash flow. The only return is price appreciation.
Holding the same value in 10-year Treasuries pays you the real yield in purchasing power. Holding it in cash pays you the short-term real yield. Holding it in gold pays you zero.
This sets up the opportunity cost. When the alternative — Treasuries, cash — pays a positive real yield, gold's zero yield is a cost. The longer you hold gold, the more real return you give up. In equilibrium, gold has to lose value (in real terms) to compensate, because otherwise everyone would prefer gold to Treasuries and the price would adjust until the expected return rebalanced.
When the alternative pays a negative real yield, the math flips. Treasuries now lose you purchasing power every year. Cash does the same. Gold's zero yield becomes a relative advantage. The longer you hold, the more you gain relative to Treasuries. In equilibrium, gold has to appreciate to clear the opportunity cost gap.
This is the mechanism. It is not a sentiment-driven correlation. It is, near-mechanically, the way gold has to price relative to the alternative real return.
The empirical correlation across the TIPS era (1997 to present) is roughly -0.75 to -0.85 measured on monthly changes. That is one of the strongest single-variable correlations you will find in any major market.
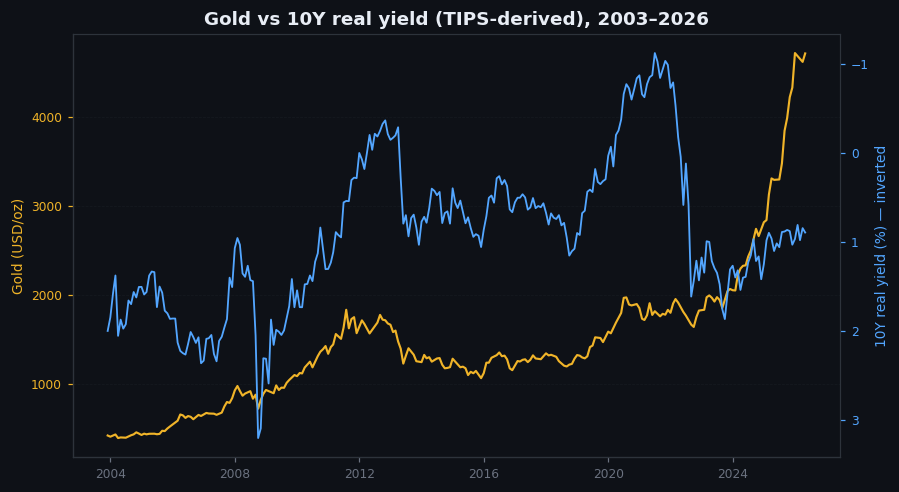
Figure 11.1 — Gold price and US 10-year TIPS yield, 2003–2026
Two-panel chart with shared time axis. Top panel: monthly gold price in USD, 2003 to 2026. Bottom panel: monthly US 10-year TIPS yield over the same period, with the y-axis inverted (so falling yields go up, matching gold's direction). Visible: tight tracking through most of 2003-2022. Visible divergence from late 2022 onward as gold continued rising while TIPS yields rose to multi-year highs.
When the relationship breaks
It has broken, in a meaningful and instructive way, in the current regime.
From October 2022 through mid-2026, the US 10-year TIPS yield rose from -0.4% to roughly +2.2%. By the historical correlation, gold should have fallen sharply — perhaps to $1,200-$1,400. Instead, gold rose from $1,650 to $4,700.
This is the largest sustained breakdown of the gold-real-yield relationship in the post-1997 era.
The explanation is the one developed across Chapters 3, 4, and 10: central bank reserve buying. Roughly 1,000 tonnes a year of price-insensitive central bank purchases overwhelmed the real-yield-driven Western demand signal. The marginal buyer changed, and with it the variable that prices the market.
For a trader, the implication is not that real yields stopped mattering. They still matter. But they are no longer the master variable in this regime. They are a variable, alongside central bank flows, with neither alone now sufficient to call direction.
The relationship will reassert itself when one of two things happens:
- Central bank buying decelerates to historical norms. At that point real yields return as the dominant driver.
- Real yields move to an extreme that overwhelms even price-insensitive central bank buying. Historically this has required real yields above +3% sustained, which we have not seen.
Until then, watching only real yields will misprice the market. Watching only central bank flows will too. The discipline is to watch both and to know which is in the lead each month.
A practical workflow
For the trader actually trying to use real yields tactically:
- Open a daily chart of
TYXor^TNXfor nominal 10-year yields and a chart ofTIPETF or the FRED series for real yields. Both should be on every gold trader's screen. - Watch for the direction. A 10-bp move in real yields on a single day is meaningful. A 25-bp move is significant. A 50-bp move requires you to update your gold view immediately.
- Watch for the level. Real yields above +1.5% are historically a strong gold headwind. Above +2.5% they have historically been incompatible with sustained gold rallies — until 2023-2026, when central bank buying broke that ceiling.
- Cross-check with central bank flow data. PBoC monthly updates, WGC quarterly central bank data, news headlines tagged with central bank buying. If real yields are rising but central banks are buying aggressively, gold can rally anyway.
This workflow takes 5 minutes a day once set up. It is, for my money, the highest-ratio research a discretionary gold trader can do.
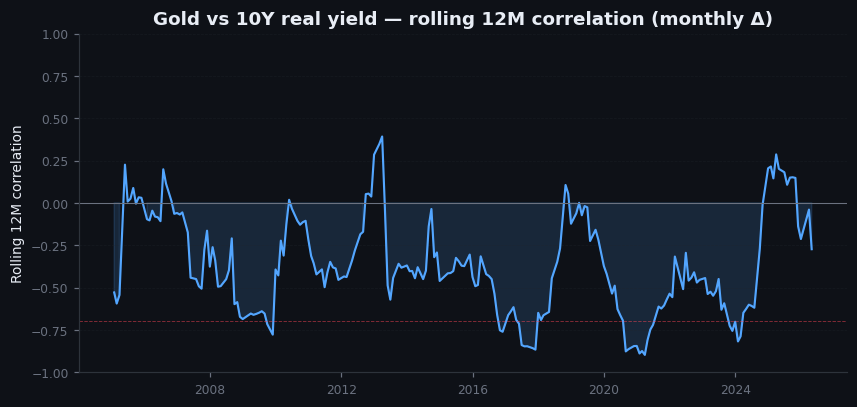
Figure 11.2 — Rolling 12-month correlation, gold vs 10Y real yield, 2000–2026
Line chart. Rolling 12-month correlation coefficient between monthly changes in gold and monthly changes in the 10-year real yield. Most of the period: correlation between -0.6 and -0.9 (strong negative). Visible deterioration from mid-2023 to 2026, with correlation rising toward zero (i.e., the relationship breaking). Annotation explaining the central-bank-driven divergence.
On goldintel today
The dashboard's Market Drivers panel surfaces the nominal US 10-year yield. It does not currently surface the 10-year TIPS yield directly — which is the variable you actually want. This is a fixable gap; the data is free and updates daily from the Treasury. Until it is added, treat the nominal 10-year as a proxy and mentally subtract the breakeven inflation rate (visible in the news flow and on the Cleveland Fed's inflation expectations page) to get an approximate real yield. The proxy is imperfect but directionally useful.
When the nominal 10-year moves and breakevens do not, that is a real yield move. When both move together, the real yield is unchanged and the move is an inflation-expectations story (different driver, different gold response).
Common mistakes
- "Nominal yields drive gold." They do, but only as the inferior proxy for real yields. Watching nominal alone will mislead you in regimes where breakevens are moving.
- "Real yields don't matter anymore." They still matter. They are not currently the dominant driver, but they remain a major one. In any future regime where central bank buying decelerates, real yields will retake the lead.
- "TIPS yields and real yields are the same thing." TIPS yields are the cleanest market measure of real yields, but they have some technical quirks (deflation floor on principal, liquidity premia at certain maturities) that can introduce noise. For tactical trading the 10-year TIPS is good enough; for high-precision macro work, model-based real yield estimates are more reliable.
- "I'll just watch the chart of TIPS prices." No — watch the yield, not the price. Yield is what the trader cares about; price is just the inverse of yield expressed differently.
Key takeaway
Real yields are the master variable in normal regimes. They are subordinate to central bank flows in Regime 6. Watch both, know which is leading, and never trade gold without checking real yields first.
Further reading:
- Federal Reserve Bank of Cleveland, Inflation Expectations model and methodology.
- John Cochrane, "The Macroeconomics of Stocks and Flows" lecture notes — the cleanest formal explanation of real yields and asset pricing.
- For the empirical correlation history: Kit Juckes (Société Générale) and various Goldman Sachs commodities research notes have published the running gold-real-yield correlation for years.
- US Treasury Department, Daily Treasury Real Yield Curve Rates, free at treasury.gov.
Quick reference
| 10Y TIPS yield range | Historical gold response | Notes |
|---|---|---|
| Below −0.5% | Strong bull | Negative real rates force allocation |
| −0.5% to +0.5% | Bullish bias | Neutral cost of carry |
| +0.5% to +1.5% | Mixed | Mild headwind |
| +1.5% to +2.5% | Bearish (pre-Regime 6) | Strong headwind historically |
| Above +2.5% | Historically incompatible | Broken in 2023–2026 by CB buying |