Chapter 17 — The cross-assets that matter (oil, silver, BTC, yen)
A gold trader does not need to watch every cross-asset. There are too many, and most have only weak or conditional relationships with gold. But four cross-assets carry consistent enough signal that any serious gold workflow should keep them on screen. They are:
- Oil — the inflation and geopolitics proxy.
- Silver — gold's hyperactive sibling.
- Bitcoin — the digital store-of-value debate, partially.
- Japanese yen — the real-yield proxy via the carry trade.
Each tells you something different about the gold environment. None of them is a trade signal by itself. Together they form a confirmation matrix: when gold is moving in line with the cross-assets, the move has structural support; when gold is diverging from one or more, that divergence is information.
Oil
The gold-oil relationship has two channels: inflation and geopolitics.
The inflation channel: oil prices feed directly into headline inflation through gasoline, transportation, and (with a lag) most other goods. Higher oil prices over multiple months mean higher CPI prints, which can shift inflation expectations, which can lower real yields (if the Fed is perceived to under-respond), which is bullish for gold.
The geopolitics channel: events that disrupt oil supply (Middle East conflicts, Russian sanctions, OPEC+ decisions) often coincide with safe-haven demand for gold. Both assets respond to the same geopolitical input in the same direction.
The empirical correlation between gold and oil monthly returns is roughly +0.3 over the past 30 years — meaningful but far from determining. When the correlation runs higher (above +0.5 for sustained periods), the two assets are being driven by the same macro variable (typically inflation or geopolitics). When it runs lower or turns negative, gold and oil are responding to different drivers — usually because the Fed reaction function is being repriced (hawkish Fed = bad for gold, neutral for oil).
For a trader, the oil-gold cross-check is most useful at inflection points. If oil breaks out from a base and gold is not moving, the gold market is implicitly saying it does not believe the inflation channel will trigger. If oil collapses and gold holds, the gold market is signaling that other drivers (Fed, central bank flows) are stronger than the inflation channel.
Silver
Silver is gold's twin, with one major difference: it has substantial industrial demand. Roughly 50% of annual silver demand goes to electronics, solar panels, and other industrial uses. The other 50% is investment and jewelry — the gold-like portion of the silver complex.
This dual demand structure creates two key behaviors:
- In gold bull markets, silver outperforms gold. Both rally, but silver moves 1.5-3x faster. The 2010-2011 gold bull saw gold rise 50% and silver rise 165%. The 2020 rally saw gold up 25% and silver up 65%.
- In gold bear markets, silver underperforms gold. Both fall, but silver falls harder. The 2011-2015 bear saw gold down 45% and silver down 70%.
The asymmetry is because silver carries leveraged exposure to gold's underlying drivers. When the drivers are bullish (low real yields, weak dollar), silver's investment demand piles in on top of stable industrial demand. When the drivers are bearish, silver loses both layers of demand — investment flows out while industrial demand softens with the broader economic cycle.
For a trader, the most useful silver-derived signal is the gold-silver ratio — the price of gold divided by the price of silver. The ratio compresses the information from both metals into a single number:
- GSR rising = gold outperforming silver. Usually a risk-off, deflationary-bias signal.
- GSR falling = silver outperforming gold. Usually a risk-on, reflationary signal. Bullish for both metals at the start of these moves.
The GSR has averaged about 65:1 over the past 40 years, with a typical range of 40 to 90. Above 90, silver is historically cheap to gold and the ratio tends to mean-revert (silver outperforming). Below 50, gold is historically cheap to silver and the reverse holds.
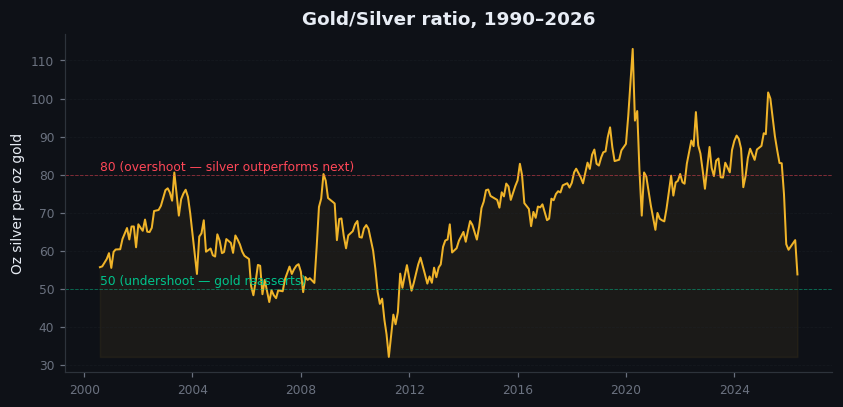
Figure 17.1 — Gold-silver ratio, 1990–2026
Line chart. Monthly gold-silver ratio, 1990 to present. Reference bands at 40, 65, 90. Visible: spikes above 90 in 1991, 2008, 2020 (each followed by silver outperformance). Visible: troughs below 40 in 1998, 2011 (each followed by gold catching up). Annotation explaining the mean-reversion behavior.
Bitcoin
Bitcoin is the youngest cross-asset on this list and the most controversial. Bitcoin advocates argue it is "digital gold" — a non-sovereign store of value with similar properties. Bitcoin skeptics argue it is a speculative tech asset whose correlation with gold is incidental.
The data, from Bitcoin's existence (2009 to present) and especially from the period when it became institutionally tradeable (2017 to present), supports a nuanced view:
- In normal regimes, gold and Bitcoin have a weakly positive correlation (about +0.2). Both respond to dollar weakness, both attract speculative flows during risk-on periods.
- In acute risk-off regimes, gold and Bitcoin decouple sharply. Gold rises (or holds), Bitcoin falls. The March 2020 example: gold lost ~10% in the worst week, Bitcoin lost ~50% in the same week. Bitcoin behaves like a high-beta tech stock in stress, not like a safe-haven asset.
- In fast liquidity crises, both gold and Bitcoin can fall together, but Bitcoin falls much more.
The implication: Bitcoin is not digital gold for trading purposes, regardless of the philosophical framing. The correlation is too weak and the stress behavior is too different. But Bitcoin is useful as a risk appetite indicator — when BTC is rallying without a fundamental catalyst, retail risk appetite is high; when BTC is falling sharply, retail risk appetite is collapsing. That sentiment signal flows through to gold in predictable ways.
For a gold trader, Bitcoin is most useful as a sentiment thermometer, not as a directly correlated asset.
The Japanese yen
The Japanese yen is the cleanest single FX cross for gold, for a reason that requires a brief explanation.
The Japanese carry trade — borrowing in low-yielding yen and investing in higher-yielding dollar assets — has been one of the world's largest macro trades for 25 years. When this trade is on, the yen weakens (USD/JPY rises) and capital flows into US assets including Treasuries (driving real yields up, bad for gold).
When the carry trade unwinds — typically because risk appetite drops, or because BoJ policy shifts, or because volatility spikes — the yen strengthens (USD/JPY falls), capital flows out of US assets, and US real yields tend to fall as a consequence. That is bullish for gold.
So: USD/JPY direction contains information about real yields, which is the master variable for gold. The relationship is indirect but consistent.
The empirical correlation: gold and USD/JPY have a -0.4 to -0.6 correlation over most of the past 25 years. A USD/JPY sustained drop below technical support levels (especially 150 in 2024-2026, 145 in earlier periods) tends to coincide with gold strength. A USD/JPY rally above technical resistance tends to coincide with gold weakness.
The August 2024 yen carry trade unwind is the cleanest recent example. USD/JPY fell from 162 to 142 in three weeks. Gold rallied from $2,400 to $2,520 over the same period. The yen move was the proximate cause; the real-yield drop was the mechanism; the gold rally was the consequence.
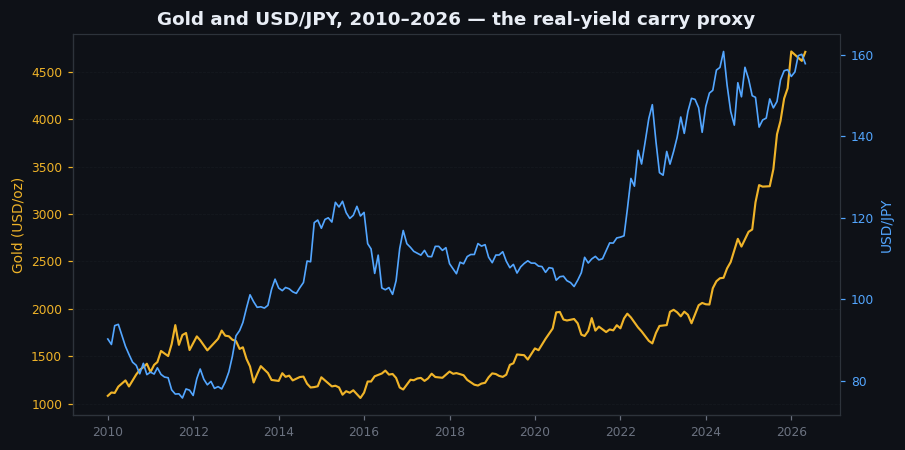
Figure 17.2 — Gold and USD/JPY, 2010–2026
Two-panel chart. Top: monthly gold price. Bottom: USD/JPY, with y-axis inverted (so yen strength goes up, matching gold direction). Visible: tight tracking through most periods. Annotations at major carry-trade unwinds: 2016, March 2020, August 2024.
On goldintel today
The dashboard does not yet surface silver, BTC, or USD/JPY in the Market Drivers panel. The session briefs reference XAGUSD, USDJPY, and BTC in the confluence scoring logic, but the dashboard front-end does not display them. This is a gap worth closing — the four cross-assets in this chapter are all free data, all relevant, and would significantly improve the dashboard's signal density.
Until then, keep TradingView tabs open for XAGUSD, USDJPY, and BTCUSD alongside XAUUSD. Five minutes a day to cross-check gold's move against the other three is high-value research.
Common mistakes
- "Bitcoin is digital gold." Philosophically debatable; empirically false for trading purposes. Bitcoin decouples from gold in stress, often violently.
- "Silver leads gold." Both move together; silver moves more. Silver's "lead" is just leverage, not predictive power.
- "Oil and gold are always correlated." Average correlation is +0.3 — meaningful but far from a trade-grade signal. Oil-gold divergences are informative; assuming co-movement is not.
- "USD/JPY is just a yen FX trade." It is also a real-yield indicator. Don't ignore it just because FX is not your usual surface.
Key takeaway
Four cross-assets to keep on screen: oil, silver, Bitcoin, yen. None is a gold trade signal alone. Together they form a confirmation matrix that catches divergences before the gold price reveals them.
Further reading:
- World Gold Council, Gold vs Other Asset Classes periodic research notes.
- For the gold-silver ratio: Adrian Ash's columns at BullionVault and Ted Butler's silver analysis (long-running, sometimes contrarian, useful for the manipulation angle).
- For Bitcoin-gold correlation: NYDIG and Galaxy Digital research notes (multiple editions through 2022-2025).
- For yen carry trade: various Reuters and FT analyses, especially around the August 2024 unwind. Adam Tooze's Chartbook covered it well at the time.
Quick reference
| Asset | Correlation with gold (daily, 5y) | Notes |
|---|---|---|
| Silver | +0.75 to +0.85 | Leveraged proxy, higher vol |
| DXY | −0.6 to −0.8 | Strongest negative |
| USD/JPY | −0.5 to −0.7 | Real-yield proxy via carry |
| Oil | +0.2 to +0.4 | Inflation/geopolitics overlap |
| BTC | +0.1 to +0.3 (normal); decouples in stress | Not a safe-haven equivalent |
| SPX | −0.1 to +0.2 | Regime-dependent |
| VIX | +0.1 to +0.4 (rises in stress) | Imperfect risk-off proxy |