Chapter 24 — Momentum: where RSI works, where it lies
The Relative Strength Index (RSI) is the most widely cited technical indicator in retail trading. It is also one of the most widely misused. The standard interpretation — "RSI above 70 means sell, RSI below 30 means buy" — is correct some of the time and disastrously wrong other times. The same is true of MACD, of stochastic oscillators, of any momentum indicator you might point to. Understanding the regime in which momentum indicators work, and the regime in which they fail, separates traders who use indicators as decoration from traders who use them as signal.
This chapter is about that distinction.
What RSI actually measures
RSI is a momentum oscillator. It compares the average size of recent up-day price changes against the average size of recent down-day price changes, scaled to a 0-100 range. The standard parameter is 14 periods (14 days on a daily chart, 14 hours on an hourly chart, etc.).
The math:
RSI = 100 - (100 / (1 + RS)) Where RS = Average gain over n periods / Average loss over n periods
When recent gains dominate losses, RS is high, and RSI rises. When recent losses dominate gains, RS is low, and RSI falls.
The threshold interpretation:
- RSI > 70: "Overbought." Recent gains have been disproportionately large. In some markets, this signals a potential reversal.
- RSI < 30: "Oversold." Recent losses have been disproportionately large. In some markets, this signals a potential reversal.
- RSI 40-60: Neutral. No strong momentum bias.
The "in some markets" qualifier is where the entire chapter lives.
Where RSI works
RSI works as a reversal signal in range-bound markets. When price is oscillating between two levels — a horizontal support and resistance band — momentum exhaustion at the top of the range tends to coincide with price reversals. Similarly at the bottom. The mean-reversion nature of range markets matches RSI's design.
The cleanest gold example: the consolidation between $1,650 and $2,070 from mid-2022 through late 2023. Across that 16-month range, RSI > 70 at the top of the range coincided with reversals back down within 5-10 days, and RSI < 30 at the bottom coincided with reversals back up. A trader using RSI thresholds in that range had a high-probability tactical edge.
RSI also works well as a divergence signal in trending markets. When price makes a new high but RSI fails to make a new high, the underlying momentum is weakening even as the trend persists. This is a bearish divergence and often precedes a meaningful pullback or reversal. The reverse — price makes a new low while RSI makes a higher low — is a bullish divergence.
Where RSI fails
RSI fails as a reversal signal in trending markets. In a strong uptrend, RSI can sit above 70 for weeks while price continues making higher highs. A trader who shorted gold every time RSI crossed above 70 during the 2024-2026 rally would have been stopped out repeatedly. The "overbought" reading in a strong trend is not a signal to fade; it is a signal that momentum is strong and the trend has more legs.
The clearest examples:
- 2010-2011 bull market: gold's daily RSI was above 70 for weeks at a time during multi-month rallies. Each "overbought" period was followed by more gains, not pullbacks.
- 2020 March-August rally: RSI ran above 70 from late March through early August almost continuously. Gold rose from $1,470 to $2,089 over that period.
- 2024 H2 rally: RSI was above 70 for sustained stretches during the run from $2,300 to $2,800. Every "overbought" signal was a false reversal call.
The same principle applies in strong downtrends — RSI below 30 for sustained periods does not signal oversold, it signals the trend is strong.
The discipline: RSI thresholds work in ranges; they fail in trends. Before applying the 70/30 rule, identify whether you are in a range or a trend.
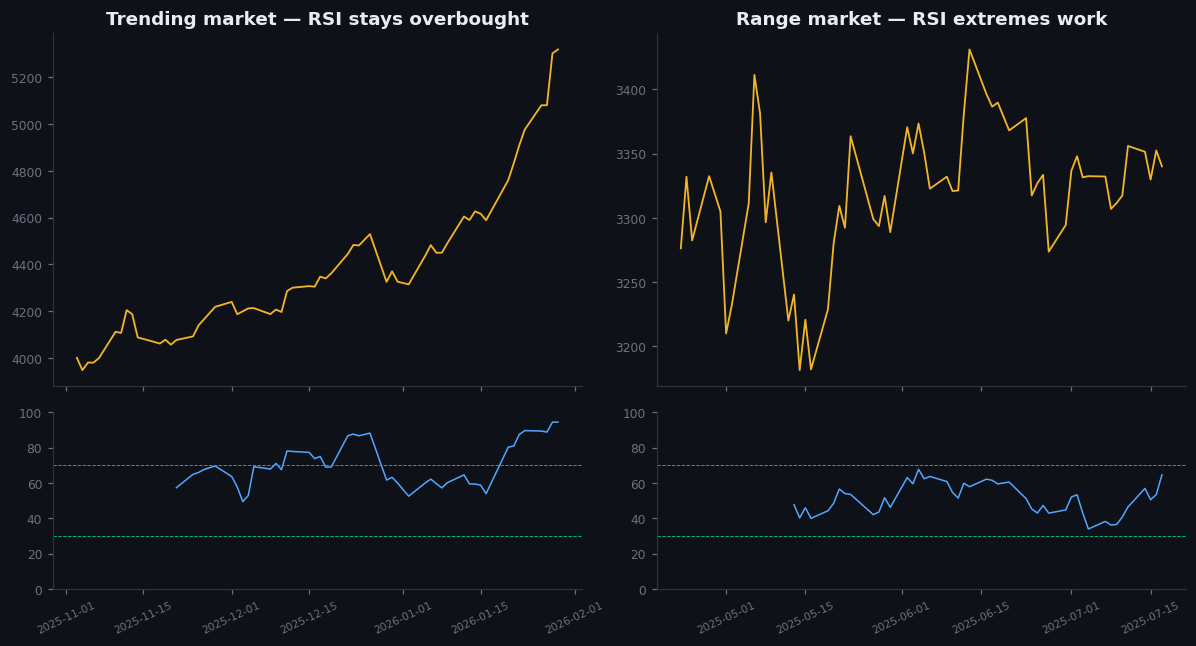
Figure 24.1 — RSI in a trending market vs a range market
Two-panel chart. Top: daily gold price and 14-day RSI during the 2020 March-August rally — RSI sits above 70 for weeks while price rallies $600. Bottom: daily gold price and 14-day RSI during the 2022-2023 consolidation — RSI cleanly oscillates between 30 and 70, with extremes coinciding with reversals at the range boundaries.
Divergence — the more useful signal
Even in trending markets, RSI carries usable information through divergence. Divergence occurs when price and RSI disagree about the strength of a move:
- Bullish divergence: Price makes a lower low, but RSI makes a higher low. This signals that the down-momentum is weakening. In an established downtrend, this is often the early warning that a reversal or significant bounce is coming.
- Bearish divergence: Price makes a higher high, but RSI makes a lower high. The up-momentum is weakening. In an established uptrend, this signals that a pullback or reversal is becoming more likely.
Divergence is not a timing signal — divergences can persist for weeks before resolving. But it is a condition that, when combined with other signals (price breaking a key level, a higher-timeframe trend exhausting), produces meaningful trade setups.
For gold specifically, daily-chart bearish divergences during sustained rallies have a reasonably good track record of preceding pullbacks of 5-10% within a few weeks. Bullish divergences during sustained declines work similarly. The accuracy is far from 100% but it is meaningfully above coin-flip.
MACD — RSI's slower cousin
The Moving Average Convergence Divergence (MACD) is the other momentum indicator worth knowing. It is calculated as the difference between two exponential moving averages (typically 12-period and 26-period), plotted alongside a signal line (typically the 9-period EMA of the MACD itself).
MACD differs from RSI in two important ways:
- It is unbounded (no 0-100 scale), so absolute readings matter less and changes matter more.
- It incorporates trend information directly through the EMA construction. MACD therefore handles trending markets better than RSI's threshold-based signals.
For gold, MACD's most useful applications are:
- Signal line crosses. When MACD crosses above its signal line, momentum is shifting bullish. When it crosses below, momentum is shifting bearish. These are weaker signals than the chart structure, but they confirm momentum shifts cleanly.
- Zero-line crosses. When MACD crosses above zero, the shorter EMA is now above the longer EMA — confirming an uptrend on the underlying timeframe. When MACD crosses below zero, the reverse.
- Histogram divergence. Like RSI divergence, but with the MACD histogram. Often gives earlier warning than RSI divergence on the same chart.
The downside of MACD: it is laggier than RSI. By the time MACD confirms a trend shift, much of the price move has often already occurred. Use MACD for confirmation and trend following, not for early entries.
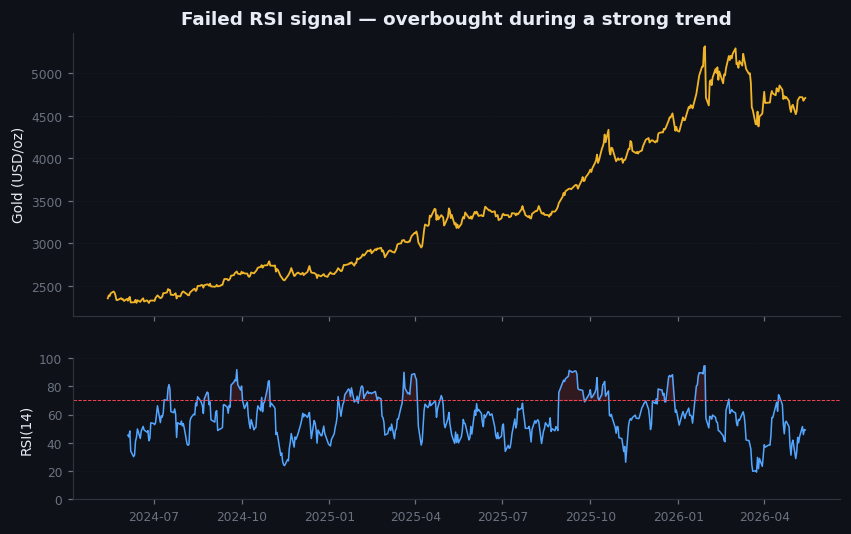
Figure 24.2 — Failed RSI signal in a strong trend
Daily chart of gold during one of the strong rally segments of 2024. RSI marked at every reading above 70 — visible 8-10 such readings over a 4-month window. Each marked with a forward arrow showing what happened to price over the following 5 days: in almost every case, price continued higher. The "overbought" signal was wrong every time. Annotation explaining the trend regime.
On goldintel today
The dashboard's Technical Indicators panel surfaces RSI across multiple timeframes via the TVRemix data feed. Direct reading: RSI value plus a "Buy / Sell / Neutral" interpretation.
A reasonable workflow: read the RSI value, but ignore the "Buy / Sell / Neutral" tag without first confirming whether you are in a range or a trend. The tag is mechanical — it does not incorporate trend context. RSI > 70 will be labeled "Sell" by the panel even in a roaring bull market, and using that signal will lose money during trending phases.
The session briefs do incorporate trend context in their factor scoring, but the indicator panel itself does not. Be careful about treating the panel's interpretation as a trade signal.
Common mistakes
- "RSI above 70 means short." Only in range conditions. In a strong trend, this is a losing trade.
- "RSI is broken on gold." It is not broken; it is being applied to the wrong regime. RSI works perfectly well in ranges, which gold has plenty of.
- "Divergence always works." It produces actionable signals more often than threshold readings, but it is far from infallible. Divergences can persist for weeks before resolving.
- "I'll just combine RSI with MACD and the result will be more reliable." Combining mediocre signals does not produce a good signal. It produces a more complex mediocre signal. Better to use one indicator well and pair it with chart structure.
Key takeaway
RSI is a regime-aware tool. In ranges, RSI extremes signal reversals. In trends, RSI extremes signal continuation. Always identify the regime before applying the threshold rules.
Further reading:
- J. Welles Wilder, New Concepts in Technical Trading Systems — the original RSI paper, still worth reading.
- John Murphy, Technical Analysis of the Financial Markets. Chapter on momentum indicators is comprehensive.
- For the trend-vs-range distinction specifically: Constance Brown, Technical Analysis for the Trading Professional — significantly more nuanced than most retail-oriented texts.
- For divergence trading: Linda Bradford Raschke and Larry Connors, Street Smarts.
Quick reference
| RSI(14) zone | Interpretation | Action |
|---|---|---|
| ≥ 80 | Extreme overbought | Don't chase; wait for divergence/cooling |
| 70–79 | Overbought | Tighten longs, look for short setups |
| 50–70 | Bullish momentum | Trend-following long bias |
| 30–50 | Bearish momentum | Trend-following short bias |
| 20–30 | Oversold | Look for long setups |
| ≤ 20 | Extreme oversold | Bounce probability high |