Chapter 9 — ETFs: the bridge between paper and physical
On November 18, 2004, the SPDR Gold Trust began trading on the New York Stock Exchange under the ticker GLD.
It was, at the time, controversial. Critics from the goldbug end of the market complained that GLD was a "paper" claim on gold, no better than a futures contract dressed up as a stock. Critics from the institutional end complained that it would distort the spot market, that authorized participants could be cornered, that the trust's holdings could be rehypothecated, that — pick your structural worry.
Twenty-two years later, GLD holds roughly 950 tonnes of physical gold in a London vault and is the largest privately owned gold holding in the world after the central banks of the US, Germany, IMF, Italy, France, and the IMF reserve pool. Its sister fund IAU holds another 400 tonnes. The European-domiciled physical ETFs (iShares Physical, WisdomTree, Invesco Physical Gold) collectively hold another 700 tonnes. Together, the physical gold ETF complex sits on roughly 2,500 tonnes — more than the official reserves of every country except the US, Germany, Italy, France, Russia, and China.
Two decades on, the goldbugs and the institutional critics both turned out to be wrong about the same thing: GLD is not paper gold. It is physical gold, in vaults, with a continuous audit trail. What it is, and what makes it different from owning a coin or a bar, is the layer of legal and operational machinery that converts physical gold into something a Western retail investor can buy in their brokerage account.
This chapter is about that machinery — how it works, why it matters for the price, and what ETF flow data tells you about the gold market that no other indicator does.
How a physical gold ETF actually works
The structure is, mechanically:
- The trust. A legal entity (SPDR Gold Trust for GLD; iShares Gold Trust for IAU) that holds physical gold bars in a vault. The trust does not trade; it just holds.
- The custodian. A bank that physically stores the gold — for GLD, HSBC's London vault; for IAU, JPMorgan and ICBC Standard.
- The authorized participants (APs). A handful of large financial institutions (the same bullion banks from Chapter 8) that have the right to create and redeem shares in baskets of 100,000.
- The shares. Each share represents a fractional claim on the gold held. For GLD, one share = roughly 1/10th of an ounce (it started at exactly 1/10th and slowly decays as the trust deducts its 0.40% annual expense ratio from the gold backing). Retail and institutional investors trade these shares on the stock exchange.
When demand for GLD shares exceeds supply, the share price drifts slightly above the NAV (the spot gold price divided by the per-share gold backing). An AP arbitrages this by: buying gold in the London spot market, delivering it to the GLD vault, receiving 100,000 new GLD shares, and selling those shares on the exchange. The gold backing of the trust increases by the basket size, and the share price reverts to NAV.
When demand for shares falls below supply (more sellers than buyers), the share price drifts slightly below NAV. An AP arbitrages the other way: buying 100,000 shares on the exchange, redeeming them at the trust for the underlying gold, and selling that gold in the spot market. The gold backing of the trust decreases, and the share price reverts to NAV.
This is the bridge. ETF flows — measured by the daily change in the trust's gold holdings, published every business day — are the marginal Western investor's demand signal, converted directly into physical gold buying or selling.
Why ETF flows are the cleanest sentiment indicator
There is no better single-variable read on Western retail and institutional gold sentiment than ETF flows. The reasons:
- They are published daily. Unlike COT (weekly, lagged) or central bank reserves (monthly, lagged further), ETF holdings update every trading day after the US close.
- They reflect actual capital commitment. Unlike survey-based sentiment indicators (AAII, Daily Sentiment Index), ETF flows are real money moving. People who buy GLD have made a financial decision, not stated an opinion.
- They drive physical movement. Unlike speculative futures positioning (which can change without any underlying gold moving), ETF flows are accompanied by literal gold bars moving in or out of London vaults. Every $1 of GLD inflow is roughly 0.0002 ounces of physical gold being added to the trust.
For a trader, the actionable read on ETF flows is at the extremes. Specifically:
- Multi-week sustained inflows (more than 50 tonnes added across the major Western funds in a 4-week period) indicate Western investors are getting bullish. These periods are usually associated with the middle of a sustained rally, not the start. If you are not already long, these are dangerous moments to chase.
- Multi-week sustained outflows (more than 50 tonnes removed) indicate capitulation. The 2013 ETF unwind was the canonical example — by the time it ended in late 2013, GLD had bled 500+ tonnes and Western sentiment was as bearish as it ever gets. That was the cycle low.
- Inflow spikes during price declines are interesting. They suggest investors are buying weakness — institutional accumulation rather than retail chasing. Historically these are bullish setups.
- Outflow spikes during price rallies are also interesting. They suggest profit-taking by institutional holders. Historically these mark interim tops.
The pattern that matters most is divergence between ETF flows and price. When the price is rising and ETF flows are negative, the rally is being driven by something other than Western sentiment — probably central bank buying. That divergence has been the dominant feature of the 2024-2026 portion of the current bull market.
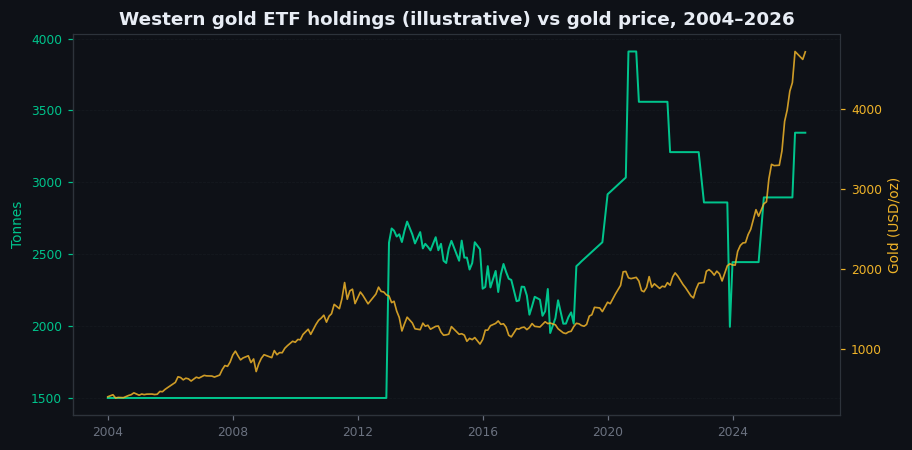
Figure 9.1 — Total Western gold ETF holdings vs gold price, 2004–2026
Two-panel chart. Top: monthly gold price 2004 to present. Bottom: total holdings (tonnes) of the major Western physical gold ETFs (GLD + IAU + European physical funds) over the same period. Visible patterns: holdings rose alongside price through 2011 (peaking at ~2,600 tonnes), unwound through 2013-2015 (down to ~1,500 tonnes), rebuilt through 2020 (peaking at ~3,400 tonnes), then declined through 2021-2024 while price kept rising — the divergence that flagged the central-bank-driven nature of the current regime.
Illustrative — illustrative Western ETF tonnage, calibrated to WGC quarterly reports.
What ETFs are not
A few things worth being clear about, because the goldbug critique of GLD has not entirely died.
GLD shares are not a claim on a specific gold bar. You cannot, as a small retail holder, redeem GLD for physical gold. Only authorized participants can redeem, and only in 100,000-share baskets (roughly $20 million worth at current prices). For practical retail purposes, GLD is a price exposure, not a delivery option.
GLD's gold is not rehypothecated, by the structure of the trust. The custodian holds physical bars allocated to the trust, with the bar list (serial numbers, weights, refiner marks) published monthly in the trust's bar list filing. This is verifiable.
GLD's gold is, however, exposed to custodian risk. If HSBC London failed catastrophically and the gold were claimed by HSBC creditors, the trust would face a legal fight. This is a tail risk that exists for any custodied asset.
For a retail trader, the practical implications: GLD and IAU are good vehicles for price exposure and excellent vehicles for short-term tactical positions (because they trade like stocks during US hours and have tight spreads). They are mediocre vehicles for long-term wealth storage if your concern is counterparty risk in extreme tail scenarios. For that, allocated physical gold in a non-bank vault (Brink's, ViaMat, Loomis, the Perth Mint) is the higher-trust option.
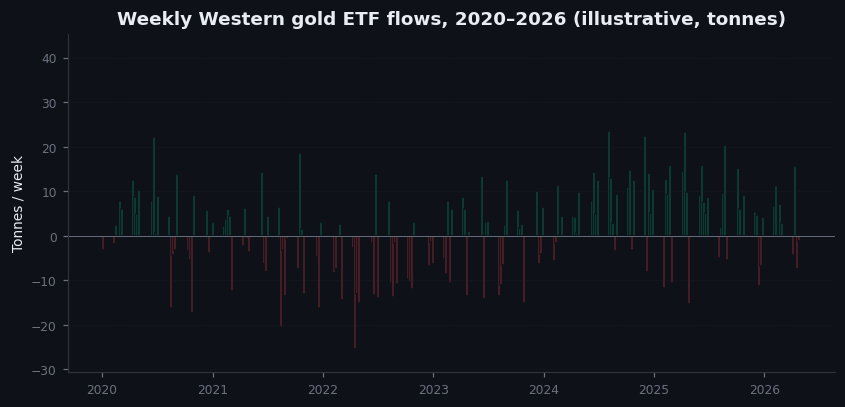
Figure 9.2 — Weekly Western ETF flows, 2020–2026
Bar chart. Weekly net change in total Western gold ETF holdings, in tonnes, from January 2020 to present. Bars green for inflows, red for outflows. Annotated extremes: March-April 2020 (record weekly inflows during COVID panic), late 2020 to mid-2021 (sustained inflows then sudden reversal), 2022-2023 (steady outflows), 2024-2025 (mixed but predominantly small flows despite rising price — the central-bank-vs-Western-flow divergence).
Illustrative — illustrative weekly ETF flows.
On goldintel today
The dashboard does not surface ETF flow data. The cleanest free source is the World Gold Council's Gold ETF Holdings page (updated daily) and the SPDR Gold Trust's own daily NAV and holdings posting on spdrgoldshares.com. For institutional users, Bloomberg's GLD HOLDINGS function and the BIS quarterly review both publish more granular data.
When you read the dashboard's news feed and see headlines about "ETF inflows" or "redemptions," cross-reference against the actual flow data. Headlines often lag the data by a day, and headlines often overstate the directional certainty — a $50 million daily flow on a $70 billion fund is noise; only the multi-week trends matter.
Common mistakes
- "GLD is paper gold." It is not. GLD holds physical bars in a London vault with a published bar list. The gold is real.
- "I can redeem GLD for gold." As a retail holder, no. Only authorized participants can redeem, in $20 million-equivalent baskets.
- "ETF flows always drive the gold price." They drive Western sentiment-led moves, which dominate some regimes (Regime 5, 2015-2020) and are subordinate in others (Regime 6, 2020-present, where central bank buying dominates).
- "GLD is the same as IAU." They are similar in function but differ in expense ratio (GLD 0.40%, IAU 0.25% at time of writing) and custodian (HSBC vs JPMorgan). For long-term holds, the expense difference matters; for short-term trading, the spread/liquidity profile of GLD is slightly better.
Key takeaway
ETFs are the bridge between Western capital and London physical gold. ETF flows are the cleanest single read on Western sentiment, and the divergence between ETF flows and price tells you which buyer category is currently driving the market.
Further reading:
- World Gold Council, Gold ETF Flows monthly commentary at gold.org.
- SPDR Gold Trust, Annual Report, current edition — read the section on creation/redemption mechanics in detail.
- For the 2013 ETF unwind specifically: Andrew Sheng and various Hong Kong Monetary Authority papers on the East-West gold flow asymmetry.
- BIS Quarterly Review, gold market sections — readable from a central bank policy perspective.
Quick reference
| ETF | AUM (~) | Structure | Trader use-case |
|---|---|---|---|
| GLD | $80 B+ | Physical (HSBC vault) | Largest, most liquid, deep options |
| IAU | $30 B+ | Physical (JPM vault) | Lower expense ratio (0.25% vs 0.40%) |
| GLDM | $10 B | Physical (smaller bars) | Cheap retail (0.10%) |
| SGOL | $4 B | Physical (Swiss vault) | Geographic diversification |
| PHYS | $9 B | Closed-end trust | Redeemable in physical (Sprott) |
| GDX/GDXJ | $20+ B | Mining equities | Leveraged proxy (high beta) |