Chapter 14 — The Fed: words, dot plots, balance sheets
Eight times a year, on Wednesdays at 2:00 PM Eastern time, the Federal Reserve releases a single piece of paper that determines the direction of gold for the following 6-8 weeks.
That piece of paper — the FOMC statement, plus the Summary of Economic Projections (the "SEP," released four times a year), plus the press conference that begins 30 minutes later — is the single most-important scheduled event in the gold calendar. Every other Fed event (the minutes release three weeks after, congressional testimony, Jackson Hole, individual speeches) is a derivative of the central question that the FOMC statement and SEP answer: what is the Fed going to do with rates over the next 12-24 months?
Almost nobody trades gold without forming a view on this question. Most retail traders form the view badly. This chapter is about how to read Fed events properly, so that the next FOMC day costs you less and earns you more.
The three things the Fed actually does
The Fed has three policy tools relevant to gold:
- The Fed Funds rate. The overnight rate at which banks lend reserves to each other. The Fed sets a target range (currently quoted as e.g., 4.25-4.50%) and uses open market operations to keep the effective rate inside that range. Every FOMC meeting decides whether to raise, lower, or hold the target range.
- The balance sheet. The Fed buys and sells Treasury securities and (since 2008) mortgage-backed securities. Quantitative easing (QE) means buying — adding reserves to the banking system and lowering longer-term yields. Quantitative tightening (QT) means letting bonds run off without replacement — removing reserves and allowing longer-term yields to rise.
- Forward guidance. What the Fed says about future policy. This includes the statement language, the dot plot in the SEP, the press conference Q&A, and the minutes. Forward guidance is currently the most-watched of the three tools because the market has learned that the Fed's words today predict its actions in 6-12 months.
For gold, all three matter, but their effect runs through real yields. Higher rates = higher real yields (if inflation expectations are stable) = gold headwind. QT = higher long-end yields = gold headwind. Hawkish forward guidance = market repricing of expected future real yields higher = gold headwind. Reverse all three for dovish/easing/lower rates.
The dot plot
The Summary of Economic Projections, released every March, June, September, and December, includes a chart called the dot plot. Each FOMC participant places a dot on a chart showing where they expect the Fed Funds rate to be at the end of the current year, the next year, the year after, and a "longer run" estimate.
The dot plot is the single most-tradeable Fed publication for gold purposes. Because:
- It is quantitative. Every observer can read the same number.
- It is forward-looking. It tells you where the FOMC thinks rates will be in 12-24 months, not just where they are today.
- It is granular. You can see the dispersion of views, the median, the modal dot, the outliers. All of these matter.
A gold trader's workflow on dot-plot days:
- Compare the new median to the previous median. A 25-bp upward shift in the year-end dot is meaningfully hawkish. A 25-bp downward shift is meaningfully dovish. A 50-bp shift in either direction is a major event.
- Compare the new median to market expectations. Fed Funds futures price an implied path. The dot plot can either ratify what futures already imply, or surprise in one direction. The surprise is what moves the gold price.
- Watch the longer-run dot. Often more important than the year-end dot. The longer-run dot is the FOMC's estimate of the "neutral" rate that neither stimulates nor restrains the economy. Changes in the longer-run dot reflect changes in the FOMC's view of the structural economy. These changes are slow but persistent — and they drive real yields over multi-year periods.
The cleanest example: the December 2018 dot plot revision was the marker that the 2018 Fed tightening cycle was ending. The median 2019 dot fell from 3.13% to 2.88%, signaling fewer hikes than previously expected. Gold rallied from $1,250 to $1,420 over the following six months. The trade was essentially front-running the macro shift the December dot plot announced.
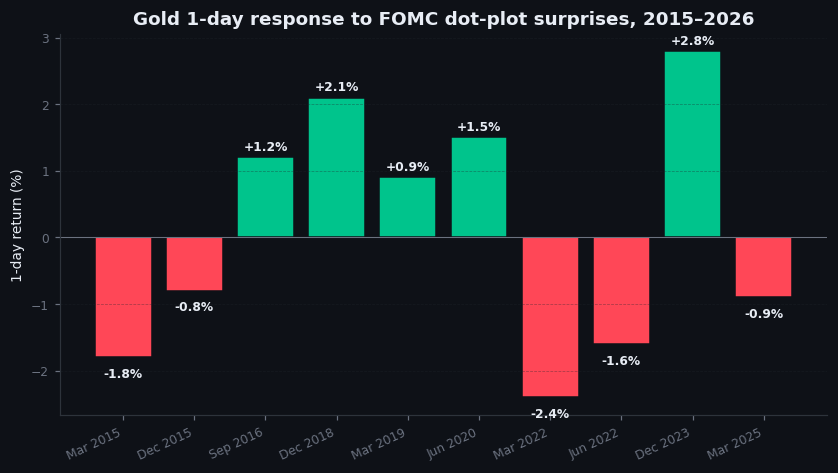
Figure 14.1 — Gold price response to FOMC dot-plot surprises, 2015–2026
Scatter plot. Each dot represents one quarterly SEP release. X-axis: surprise in the median year-end dot vs prior SEP (basis points, positive = hawkish surprise). Y-axis: gold price move over the 5 trading days following the release (percentage). Visible: clear negative slope. Hawkish dot surprises produce gold sell-offs; dovish surprises produce rallies. The relationship is real and statistically significant.
Illustrative — illustrative event study — sample of FOMC dot-plot surprises.
The balance sheet
Quantitative easing's effect on gold is one of the cleanest macro relationships ever observed. When the Fed expanded its balance sheet from $900 billion to $4.5 trillion (2008-2014), gold rallied from $700 to $1,920. When the Fed reduced its balance sheet from $4.5 trillion to $3.7 trillion (2017-2019), gold went sideways. When the Fed expanded its balance sheet from $4 trillion to $9 trillion (2020-2022), gold rallied from $1,500 to $2,089. When the Fed has been running QT (2022 onward), gold has rallied anyway — but for the central bank reserve buying reason, not for the Fed reason.
The mechanism: QE adds duration risk to the Fed's balance sheet and removes it from the market, lowering longer-term real yields. QT reverses the process. Both effects flow into gold via the real yield channel.
For a trader, the balance sheet is a slower-moving variable than the dot plot. Changes are announced at FOMC meetings, implemented over months, and felt across quarters. The directional signal matters more than the precise dollar amount. If the Fed signals it is ending QT, that is gold-bullish at the margin even if no actual change has happened yet.
Words: the statement and the press conference
The FOMC statement is short — typically under 500 words. Almost every word is fought over by the staff before release. Tiny changes in language — moving from "monetary policy" to "the stance of monetary policy," from "patient" to "data-dependent," from "appropriate" to "extended period" — carry real signal.
The traders who profit from FOMC days are not the ones who guess the rate decision (which is usually 90% priced in by the time of release). They are the ones who read the statement line by line against the previous statement, spot the language changes, and infer the policy shift those changes signal.
The press conference, beginning 30 minutes after the statement, adds another layer. The Fed Chair (Powell, since 2018) takes questions from reporters. The Chair's answers are not scripted in detail; they reveal the FOMC's reasoning and the Chair's personal lean. Two consecutive press conferences with consistent language and a third one that suddenly emphasizes a different variable — that is a regime marker. Watch carefully.
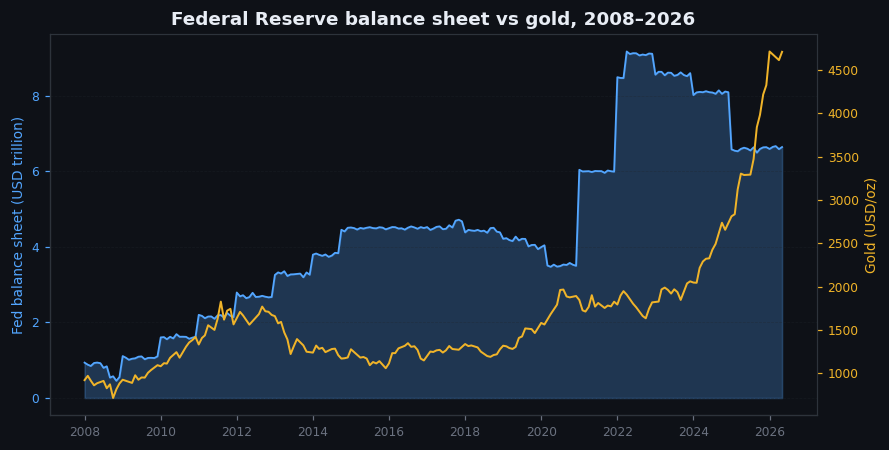
Figure 14.2 — Federal Reserve balance sheet and gold, 2008–2026
Two-panel chart. Top: total Federal Reserve assets in trillions of dollars, monthly, 2008 to present. Bottom: gold price, same period. Visible: each major QE expansion (QE1, QE2, QE3, COVID QE) coincides with a gold rally. The 2017-2019 QT phase coincides with gold sideways. The 2022-onward QT phase coincides with gold rallying anyway (regime change marker).
Illustrative — illustrative Fed balance-sheet path, calibrated to published series.
On goldintel today
The dashboard's Event Countdown panel surfaces upcoming Fed events when they are scheduled within view. The News Feed picks up FOMC statements as they release and classifies them by direction. The Session Briefs on FOMC days are particularly useful because they explicitly read the post-meeting tape.
What the dashboard does not currently surface: the dot plot data itself, the balance sheet runoff schedule, the implied path from Fed Funds futures. Adding a "Fed page" with these would be valuable. For now, the cleanest sources are the FOMC's own Summary of Economic Projections (released at the meeting) and the CME's FedWatch Tool (free, web-based) for implied probabilities.
Common mistakes
- "Trading the rate decision." The decision is usually priced in. Trading on the decision itself is trading noise. The signal is in the statement language and the dot plot, not in the rate number.
- "All Fed officials matter equally." They don't. The Chair, the Vice Chair, and the New York Fed president are the most market-moving voters. Regional Fed presidents matter less, with a couple of exceptions (the St. Louis and Atlanta Fed presidents have been influential at points).
- "Dovish = good for gold; hawkish = bad." Conditional. In a regime where the Fed is expected to be hawkish, mildly hawkish guidance is actually relieving and can rally gold. The surprise vs expectations is what matters.
- "Jackson Hole is just a speech." It is the most-watched non-FOMC Fed event of the year. The Chair's Friday morning speech in Jackson Hole has historically marked regime changes (Bernanke 2012, Powell 2022). Watch it like an FOMC meeting.
Key takeaway
The Fed moves gold through the dot plot, the balance sheet, and forward guidance — all three flowing through real yields. Trade the surprise in the dot plot, not the rate decision. Read the statement word-for-word against the previous one. Watch the longer-run dot for regime signals.
Further reading:
- Federal Reserve, Summary of Economic Projections (current and historical) at federalreserve.gov.
- CME Group, FedWatch Tool for real-time market-implied probabilities.
- Tim Duy's Fed Watch commentary — long-running, sharp.
- Roberto Perli at PiperSandler — quantitative Fed analysis with a market lens.
Quick reference
| Tool | When used | Gold impact |
|---|---|---|
| Fed funds rate | 8 FOMC meetings/year | Hawkish: bearish; dovish: bullish |
| Dot plot / SEP | March/Jun/Sep/Dec | Path of rates → real yields → gold |
| QE / QT | Programmatic | QE: bullish (liquidity); QT: bearish |
| Forward guidance | Press conferences | Direction-setting for medium-term |
| Standing repo / SRF | Plumbing | Watched for stress; usually neutral |