Chapter 22 — Smart money concepts for gold (BOS, CHoCH, OBs, FVGs)
Smart Money Concepts — SMC — is a framework that emerged from the Inner Circle Trader (ICT) community in the late 2010s. It is, depending on who you ask, either a rigorous structural framework for reading institutional order flow, or a re-branded set of classic technical concepts wrapped in proprietary jargon. The honest answer is that it is partly both.
What is clear is that SMC has become one of the dominant trading frameworks in the retail gold community since 2020, and a meaningful number of institutional desks use parts of it for execution timing. The terminology is in the air whether you choose to use the framework or not. This chapter is a practical introduction — what the concepts mean, when they work on gold, and when to disregard them.
Read this chapter knowing that SMC is a microstructure-layer framework. Per the 85:15 rule (Chapter 18), it is one of the tools in the technical 15%. It works best when aligned with the macro 85%; it fails consistently when used in isolation.
The four core concepts
SMC has accumulated a large vocabulary over the years. The four concepts that matter most for gold trading:
Break of Structure (BOS). A confirmed break of a recent swing high (in an uptrend) or swing low (in a downtrend). The break must close beyond the prior swing point, not just spike through it. A BOS confirms that the existing trend is continuing — bullish BOS = bullish trend continuing, bearish BOS = bearish trend continuing.
Change of Character (CHoCH). A confirmed break of the opposite swing point — a break above a recent swing high during a downtrend, or below a recent swing low during an uptrend. A CHoCH signals a potential trend reversal. The trend has not necessarily flipped yet, but the structure of the previous trend has been violated.
Order Block (OB). The last opposite-color candle (or cluster of candles) before a significant move. In an uptrend, the order block is the last bearish candle before price ran up; this level is interpreted as where institutional buyers stepped in. In a downtrend, the order block is the last bullish candle before price ran down. Order blocks are treated as support (in uptrends) or resistance (in downtrends) on retest. An order block is, in effect, a tightly-defined supply or demand zone — Chapter 23 develops the same idea in the more general base-and-departure framing.
Fair Value Gap (FVG). A three-candle pattern where the middle candle's body has no overlap with the wicks of the candles on either side. The gap between the wick of candle 1 and the wick of candle 3 is the "fair value gap." Price is interpreted to return to fill this gap, providing a target for mean-reversion trades.
These four concepts are the SMC trader's vocabulary. There are dozens of other terms in the broader ICT framework — liquidity sweeps, mitigation blocks, premium and discount zones, optimal trade entries, etc. — but mastery of BOS, CHoCH, OB, and FVG covers most of the practical value.
Why SMC works on gold (when it does)
Three structural features of the gold market make SMC particularly applicable:
- 24-hour continuous pricing. Gold's continuous OTC market means the chart has no gaps between sessions (other than weekends). Order blocks, FVGs, and structural levels stay intact rather than being disrupted by overnight gaps the way equity charts are.
- Deep liquidity. Gold's intraday liquidity is among the deepest in any liquid market. Institutional orders are large enough to leave structural footprints on the chart in the form of identifiable order blocks and breaks.
- Clear session boundaries. Despite continuous pricing, gold has distinct Asian, London, and New York sessions with characteristic behaviors. SMC concepts apply cleanly to session-based liquidity dynamics — the London open, the New York open, end-of-session liquidity sweeps.
For these reasons, gold has become one of the most SMC-traded instruments in retail. The pattern recognition produces more reliable setups than it does on, say, equity indices (where overnight gaps and circuit breakers disrupt the structural reading).
Why SMC fails (when it does)
The framework fails in two specific situations:
When SMC is used against the macro tide. A clean SMC long setup in a bearish macro regime (rising real yields, hawkish Fed, falling ETF flows) will lose money over enough trades, no matter how clean the pattern is. The macro current is too strong for the microstructure to override. This is the most common SMC failure mode for retail traders, and it is responsible for most of the "SMC doesn't work" complaints.
When SMC concepts are interpreted too loosely. "Order blocks" can be drawn almost anywhere if you look hard enough. "Fair value gaps" can be identified at multiple resolutions, producing dozens per chart, of which most never matter. The framework requires discipline to apply — strict definitions, confluence requirements, and patience for setups that meet the criteria rather than forcing setups that don't.
The remedy in both cases is to use SMC strictly and selectively. Identify high-probability setups that meet all of:
- Aligned with the macro bias (Chapter 18).
- Form on a meaningful timeframe (4H or daily for swing trades; 15-30M for intraday).
- Have a clear and tight risk level.
- Coincide with horizontal levels, round numbers, or session boundaries that add confluence.
A trader who applies SMC this way gets maybe 1-3 setups per week. A trader who applies it loosely sees setups everywhere, takes too many, and produces mediocre results.
A worked SMC long setup
Walk through a concrete example.
Setup: Gold daily chart. Macro bias is bullish (Fed expected to cut, central banks buying, real yields trending down). Recent swing high at $2,720, recent swing low at $2,580. Price has been pulling back from $2,720.
Step 1 — Look for a CHoCH on the lower timeframe. On the 4H chart, you want to see price break above a swing high formed during the pullback. This signals the pullback is potentially over and the uptrend is resuming.
Step 2 — Identify the order block. Once CHoCH occurs, look for the last bearish 4H candle before the move that produced the CHoCH. That candle is the order block. In our example, suppose it's the candle at $2,640.
Step 3 — Wait for retracement to the order block. Price will often pull back to test the order block before continuing higher. The OB at $2,640 becomes your entry zone.
Step 4 — Enter on confirmation. When price touches $2,640 and produces a bullish rejection candle (long lower wick, close in the upper half), enter long. Stop goes just below the order block, perhaps at $2,625.
Step 5 — Target the prior swing high or a higher resistance. Initial target $2,720 (the prior swing high). If macro remains bullish and the structure holds, trail behind structure for an extended target.
Result: Entry $2,645, stop $2,625, target $2,720. Risk $20, reward $75. R:R = 3.75:1. Win this 30% of the time and you're profitable. Win it 50% of the time (typical for setups aligned with macro) and you're significantly profitable.
This is a clean SMC trade. The macro is aligned, the structure is identified, the risk is defined, and the reward justifies the risk. Most SMC setups can be reduced to a version of this template.
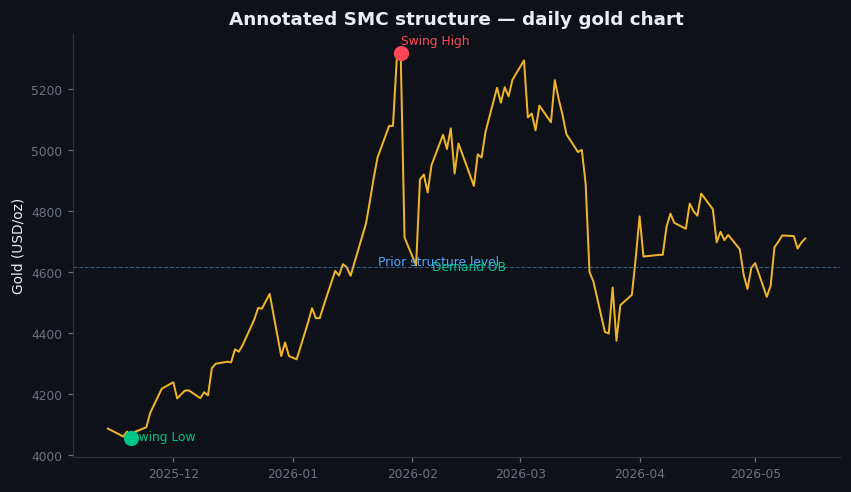
Figure 22.1 — Annotated SMC structure on a daily gold chart
Daily gold chart with SMC annotations. Visible: a recent uptrend with marked higher highs and higher lows. A pullback in progress. CHoCH marked at a specific candle. Order block highlighted as a colored zone. FVG marked in the recent rally. Entry, stop, and target levels marked with horizontal lines.
Illustrative — real candles with overlaid SMC annotations (illustrative annotation).
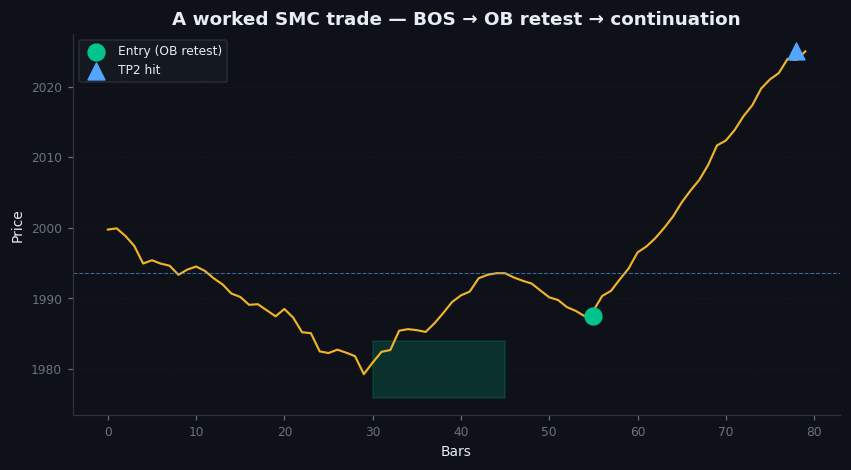
Figure 22.2 — A worked SMC trade
Same daily chart over the following 10 days. Entry at the order block highlighted. Stop level marked. Target hit at the prior swing high. The trade plays out cleanly because the macro was aligned.
Illustrative — schematic worked trade.
On goldintel today
The dashboard's SMC Panel surfaces recent BOS and CHoCH events, identified order blocks, and active FVGs derived from the TVRemix data feed. This is a useful starting point, but should not replace your own chart analysis. The panel identifies structure mechanically; the interpretation of whether a specific setup is high-probability requires the macro context that the SMC panel does not incorporate.
A reasonable workflow: use the SMC panel as a scan — when it flags a setup, look at the underlying chart and assess whether the macro alignment, level confluence, and risk parameters justify the trade. Most flagged setups will fail this filter; the ones that pass are the ones worth taking.
Common mistakes
- "SMC works on every chart." It works best on liquid, 24-hour, deep-volume markets — exactly the characteristics of gold. On equity indices, currencies with overnight gaps, or thinly-traded altcoins, SMC produces noisy signals.
- "Order blocks always hold." They hold a meaningful percentage of the time, but not always. Plan for the case where the order block breaks (your stop should be just outside it). A broken order block often signals a regime change at the microstructure level.
- "More SMC = better analysis." No. Strict adherence to the four core concepts produces better results than expanding to the 30+ concepts in the broader ICT framework. Complexity adds noise.
- "SMC is the whole strategy." It is the execution layer. The macro is the strategy layer. Mismatching the two — using SMC as a stand-alone system — produces near-random results.
Key takeaway
SMC is a microstructure framework that identifies institutional order flow on the chart. Use the four core concepts (BOS, CHoCH, OB, FVG), apply them strictly, require macro alignment, and treat setups as one input among many.
Further reading:
- Inner Circle Trader's free educational content on YouTube. Long, sometimes repetitive, occasionally controversial. The core conceptual material is genuinely useful.
- For the academic critique: research on whether ICT concepts produce statistically significant out-of-sample returns is mixed. Several practitioner backtests have found edge in macro-aligned SMC setups but not in untreated SMC signals.
- The Trading Pit's SMC Reference Guide (free PDF, multiple editions) summarizes the framework more concisely than ICT's own content.
Quick reference
| Concept | What it means | Bias signal |
|---|---|---|
| Break of Structure (BOS) | New HH (bull) or LL (bear) | Continuation |
| Change of Character (CHoCH) | First HH after downtrend / LL after uptrend | Reversal |
| Order Block (OB) | Last candle before a strong move | Re-test entry zone |
| Fair Value Gap (FVG) | Imbalance between candles 1 and 3 | Magnet for retrace |
| Liquidity sweep | Stop run beyond a prior H/L | Often a reversal trigger |