Chapter 12 — The dollar: friend, foe, and feedback loop
Gold is priced in dollars. That single arithmetic fact creates the second-most important macro variable in gold trading, after real yields.
The relationship has two layers. The first is mechanical: if the dollar weakens against other currencies, then the same amount of physical gold costs more dollars to buy. If the dollar strengthens, the same gold costs fewer dollars. This is the trivial first-order effect.
The second layer is structural and far more interesting: when the dollar weakens, gold becomes cheaper for non-dollar buyers (Indian jewelers, Chinese ETF investors, European central banks). Their demand picks up. Buying physical gold pulls bars out of the system. The price rises further. This feedback loop amplifies the original currency move, sometimes by a multiple of two or three.
The reverse also works. Dollar strength reduces non-dollar buying interest. Inventory accumulates. The price falls further than the currency move alone would imply.
This chapter is about how to read the dollar's effect on gold — properly, with the layers separated, and aware of the cases where the relationship breaks.
DXY is not the dollar
When traders talk about "the dollar" they almost always mean DXY — the US Dollar Index, computed against six other major currencies. DXY is the most common dollar reference, the most heavily traded dollar product (as DX futures), and the dollar number most likely to appear in commentary.
But DXY is a thin slice of "the dollar." Its components are:
- Euro: 57.6%
- Japanese yen: 13.6%
- British pound: 11.9%
- Canadian dollar: 9.1%
- Swedish krona: 4.2%
- Swiss franc: 3.6%
Notice what is missing: the Chinese renminbi, the Indian rupee, every other emerging-market currency, every commodity-exporter currency outside Canada. DXY is, in practice, the dollar's exchange rate against developed-market Europe. It is not a measure of the dollar's strength against the currencies that matter most for gold demand.
For gold, the more useful dollar measure is the Federal Reserve's Broad Trade-Weighted Dollar Index (TWI) or the BIS Real Effective Exchange Rate (REER). Both include the renminbi and a wider basket of EM currencies, weighted by trade flows. These move differently from DXY, especially in periods when EM currencies are doing one thing and EUR/JPY are doing another.
The classic example: through much of 2024, DXY weakened against the euro but the broad TWI strengthened because the renminbi and several EM currencies depreciated against the dollar. A gold trader watching only DXY would have called the dollar weak (bullish gold). A gold trader watching the broad dollar would have correctly seen mixed signals.
The historical correlation
The 12-month rolling correlation between gold and DXY has hovered between -0.4 and -0.7 across most of the post-1971 period. That is a meaningful negative relationship but a notably weaker one than gold vs real yields (-0.75 to -0.85).
Why weaker? Because DXY captures only one input to gold's price (relative dollar strength), while real yields capture the full opportunity-cost framework. Real yields are upstream of the dollar — they help drive the dollar — but they also incorporate inflation, growth expectations, and risk appetite in ways DXY does not.
The implication: if DXY says one thing and real yields say another, trust real yields. The dollar reading without context is incomplete.
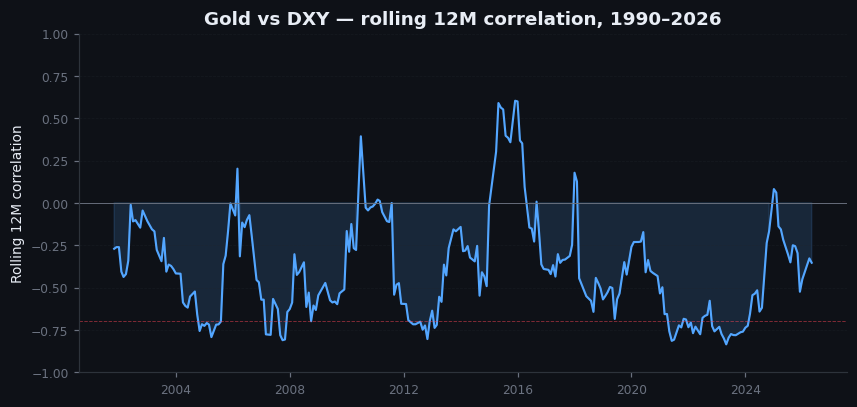
Figure 12.1 — Gold and DXY rolling 12-month correlation, 1990–2026
Line chart. 12-month rolling correlation coefficient between monthly changes in gold and monthly changes in DXY, from 1990 to present. Visible: mostly negative correlation in the -0.4 to -0.7 range. Brief periods of weak or positive correlation during crisis events (gold and dollar both rising as risk-off assets during 2008, parts of 2020, 2022). Annotation explaining the regime where both rise.
When gold and dollar rise together
In periods of acute global risk-off, gold and the dollar can rise together. Both are perceived as safe havens. Capital flees emerging markets, equities, and commodities, and parks in US Treasuries (driving the dollar up) and in physical gold (driving gold up).
The cleanest historical examples:
- September-October 2008. Lehman collapse. DXY rose roughly 16% from August to November. Gold fell initially with everything, then recovered, while the dollar continued strengthening. By early 2009 gold and DXY were both at recent highs.
- March 2020. COVID liquidation. DXY spiked from 95 to 103 in the first three weeks. Gold initially fell (Chapter 16 explains why), then recovered and rallied alongside the dollar for several weeks before the dollar resumed its longer-term weakness.
- September-October 2022. Russia, energy crisis, peak Fed hawkishness. DXY rose to 114, the strongest in 20 years. Gold bottomed at $1,615 and started rallying alongside the dollar from there — a regime change marker that we now read, in retrospect, as the start of the central bank reserve buying era.
For a trader, the rule: gold and the dollar usually move opposite, but during liquidity crises and during regime changes they can move together. The opposite-direction trade is the default; treat same-direction periods as informative anomalies that signal something else is going on.
The feedback loop in detail
When the dollar weakens, the second-order effect amplifies the price move:
- Dollar weakens by 1% against the renminbi.
- Chinese gold becomes 1% cheaper in renminbi terms.
- Chinese jewelry and investment demand picks up. Some traders front-run this expectation.
- Physical gold flows out of Western vaults toward Asia.
- Western inventory tightens. The price rises.
- The price rise reinforces dollar weakness because gold is now competing for capital inflows.
The loop runs at a multi-week to multi-month cadence. The first-order effect (point 1 to point 5) is fast. The second-order effect (point 6 back to point 1) is slow. The combined effect is that gold-dollar moves tend to trend, persistently in one direction for weeks or months, before reversing.
This is one reason gold trades in long arcs rather than choppy patterns. The feedback loop builds momentum.
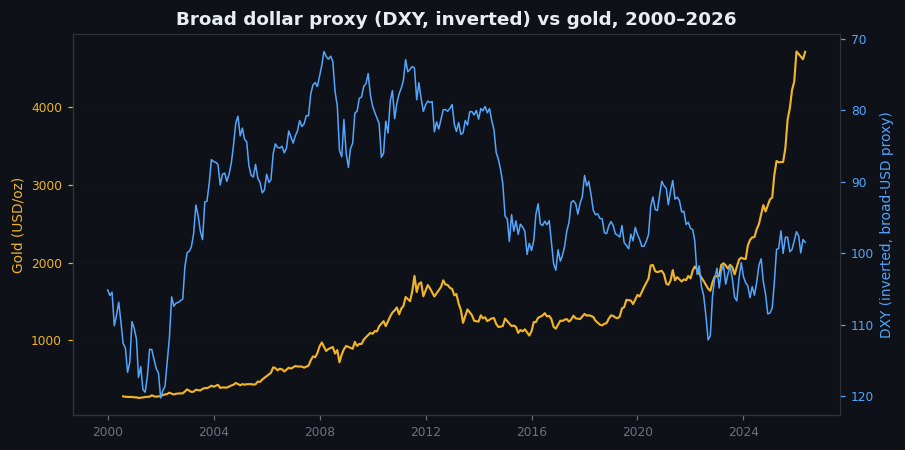
Figure 12.2 — Broad trade-weighted dollar vs gold, 2000–2026
Two-panel chart. Top: Federal Reserve Broad Trade-Weighted Dollar Index, monthly, 2000 to present. Bottom: gold price, same period, with y-axis inverted (so gold rising goes down, matching dollar direction in normal regime). Visible tight tracking through most of the period. Annotations at the divergence periods: 2008 crisis, 2020 COVID, 2022 onward (regime change).
On goldintel today
The dashboard's Market Drivers panel shows DXY. It does not currently show the broad TWI dollar. This is a fixable gap — the Fed publishes daily, and the difference matters in regimes when EM currencies are doing different things than EUR/JPY.
When the dashboard's DXY shows dollar weakness but gold is not responding, check whether the broad TWI is also weakening. If DXY is down but broad TWI is flat or up, the dollar effect on gold is muted. If both are weakening, expect the gold response to be reliable.
Common mistakes
- "Gold and the dollar always move opposite." They do most of the time, not all of the time. Liquidity crises and regime changes are the exceptions. Be ready to recognize them.
- "DXY is the dollar." DXY is one slice of the dollar — the developed-market Europe slice. For gold, the broad TWI matters more.
- "A 1% dollar move means a 1% gold move." Not quite. The feedback loop amplifies. Empirically, gold's beta to broad dollar moves is roughly -1.5 to -2 over multi-month windows — meaning a 1% sustained dollar weakness produces roughly a 1.5-2% gold rally.
- "The renminbi peg means CNY doesn't matter for gold." It is not strictly pegged any more (managed float since 2005). CNY moves against the dollar within a daily band set by the PBoC. Cumulative CNY moves over months are meaningful for gold demand.
Key takeaway
The dollar moves gold through both mechanical pricing and the feedback loop into non-dollar demand. Watch broad TWI as well as DXY, watch for the rare same-direction periods that signal regime change, and remember the dollar is downstream of real yields.
Further reading:
- Federal Reserve, Broad Trade-Weighted Dollar Index methodology and daily series.
- Maurice Obstfeld and Kenneth Rogoff, Foundations of International Macroeconomics — Chapter 7 on dollar exchange rate dynamics applies cleanly to gold.
- For DXY's structural quirks: BIS Quarterly Review articles on reserve currency dominance, several editions through 2020-2025.
- Steve Englander's various FX strategy notes at Standard Chartered.
Quick reference
| Currency | DXY weight | Driver |
|---|---|---|
| EUR | 57.6% | ECB policy vs Fed differential |
| JPY | 13.6% | BoJ policy, real-yield differential |
| GBP | 11.9% | BoE policy, UK gilts |
| CAD | 9.1% | Oil, BoC rate path |
| SEK | 4.2% | European cyclical proxy |
| CHF | 3.6% | Safe-haven, SNB intervention |