Chapter 16 — Risk-on, risk-off, and the gold response
Gold is a safe-haven asset. This is true. Gold is also a liquidity asset that gets sold first when investors urgently need cash. This is also true. The two statements coexist because they apply in different kinds of stress.
The distinction is critical and it costs traders money every time a market crisis breaks. The trader who assumes "stress = gold up" without further analysis gets blindsided in 2008, in March 2020, and during every fast deleveraging event in between. The trader who understands which kind of stress they are in gets the trade right.
This chapter is about distinguishing slow risk-off (gold up) from fast liquidity crises (gold down, then up).
Two kinds of risk-off
Most equity selloffs fall into one of two categories.
Slow risk-off is a gradual repricing of expected growth, corporate earnings, or geopolitical conditions. Markets fall over weeks or months. VIX rises gradually. Bond yields fall as investors rotate from equities to safe assets. The dollar may weaken or strengthen depending on the trigger. Gold rises smoothly throughout, as some of the capital fleeing equities and seeking duration parks in gold.
Examples:
- The 2000-2002 dot-com bear market.
- The 2007-mid-2008 grinding decline before Lehman.
- The 2018 Q4 sell-off on tightening fears.
- The August-September 2024 risk-off on growth concerns.
In all of these, gold rose as equities fell. The "safe haven" framing worked exactly as advertised. This is what most retail traders mean when they invoke gold's safe-haven property — and they are right, in this regime.
Fast liquidity crises are a different animal. They are not gradual repricings of fundamentals. They are forced selling of anything that can be sold, by investors who have lost access to credit, are facing margin calls, or have urgent dollar funding needs. Anything liquid gets sold — including gold, because gold is one of the most liquid assets on earth and gets sold first when liquidity is the constraint.
Examples:
- September-October 2008 (Lehman through TARP).
- March 2020 (COVID lockdowns, the cross-asset liquidation).
- March 2023 (regional bank failures, brief liquidity scare).
- August 2024 (yen carry trade unwind, multi-day cross-asset selling).
In all of these, gold fell sharply in the early days of the crisis even as risk assets fell. The 2008 example: gold fell from $920 to $710 between July and November 2008 — a 23% decline during what most people remember as the peak of the safe-haven trade. The March 2020 example: gold fell from $1,690 to $1,470 in two weeks at the worst of the COVID liquidation.
The differentiator: in slow risk-off, capital is rotating between assets. In fast liquidity crises, capital is being raised by selling whatever is liquid.
How to tell which one you're in
A few real-time signals distinguish slow risk-off from fast liquidity crisis:
- TED spread and equivalent funding indicators. When the cost of dollar funding spikes — TED spread widens beyond ~50 basis points, FRA-OIS widens sharply, swap lines get drawn down — you are in a liquidity crisis. Gold will be sold along with everything else in the early days.
- The dollar. Slow risk-off can produce dollar weakness (if the trigger is US-specific) or modest dollar strength (if the trigger is global). Fast liquidity crises produce sharp dollar strength as global dollar funding needs spike. A dollar move of +3% in a week is a liquidity signal.
- Bond yields. In slow risk-off, longer-end Treasury yields fall as money rotates into safety. In fast liquidity crises, Treasury yields rise (prices fall) in the early days because everything gets sold to raise cash. The shape of the yield curve flattens or inverts unusually.
- Cross-asset correlations. In slow risk-off, the usual correlations hold: equities down, gold up, dollar mixed. In fast liquidity crises, correlations invert and synchronize: equities, bonds, gold, crypto, commodities, FX all move down together against the dollar. When you see "everything is down at once," you are in liquidity, not safe-haven.
The good news: fast liquidity crises are short. They last days to weeks, not months. Once the central bank response arrives (rate cuts, emergency facilities, swap lines), the liquidity constraint releases and gold reverses sharply. The 2008 gold low at $710 in November 2008 was followed by a rally to $1,920 over the next three years. The March 2020 gold low at $1,470 was followed by a rally to $2,089 over five months.
The 2008 case study
Through the first half of 2008, gold rallied from $830 to $1,000 alongside falling equities — the "safe-haven story" was apparently working. Then Lehman went down on September 15, and things changed.
Over the following two months:
- Gold fell from $920 (Sep 12) to $712 (Nov 12), a 23% drop in 60 days.
- The S&P 500 fell from 1,251 to 818 over the same period, a 35% drop.
- The DXY rose from 79 to 88, a 12% rally.
- TED spread spiked to 458 basis points (highest in history at that point).
- Funds with leveraged gold positions faced margin calls and forced liquidation.
The gold sell-off was not a fundamental statement about gold's value. It was forced selling driven by margin and funding pressure. By the time the Fed had launched TARP, QE1, and the dollar swap lines (by year-end 2008), the liquidity squeeze had eased, gold had bottomed, and the bull market that ran to 2011 began.
A trader who sold gold at $920 because they saw the crisis as "good for gold" and were waiting for confirmation, lost money. A trader who held through the liquidity sell-off and added at $712 made one of the best macro trades of the decade.
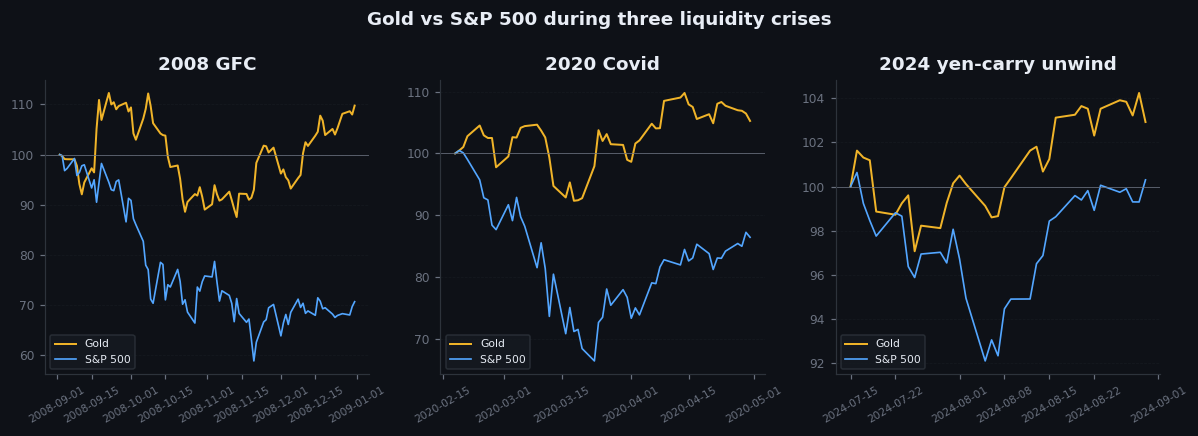
Figure 16.1 — Gold and S&P 500 during liquidity crises, 2008/2020/2024
Three small charts side by side, each showing gold and SPX over a 60-day window around the respective crisis. Visible synchronization: both assets fall together in the early days, then gold rebounds first while equities continue lower. The pattern is consistent across all three events.
VIX as a sentiment thermometer
The VIX index — the implied volatility of S&P 500 options over the next 30 days — is the cleanest single proxy for market stress, and it has a reasonably useful relationship with gold:
- VIX below 15: Calm market. Gold's safe-haven bid is dormant. Gold trades on its underlying drivers (real yields, dollar, central bank flows) without sentiment contribution.
- VIX 15-22: Normal stress. Gold gets modest sentiment support.
- VIX 22-30: Elevated stress. Gold's safe-haven bid is active. Slow risk-off regime where gold rises with stress.
- VIX above 30: Crisis stress. Two sub-regimes:
- If accompanied by funding stress (TED, FRA-OIS), you are in fast liquidity. Gold falls first, then recovers.
- If accompanied by stable funding markets, you are in slow risk-off, just severe. Gold rises throughout.
The session brief logic on goldintel uses VIX > 22 as a bullish factor for gold. This is correct for normal risk-off regimes. For VIX > 30 with funding stress, the logic would need to flip — but those events are rare enough that the simplified rule is reasonable.
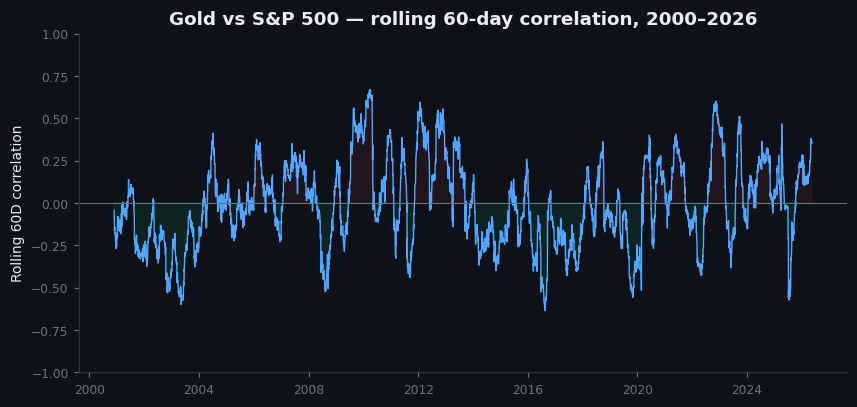
Figure 16.2 — Gold-S&P rolling 60-day correlation, 2000–2026
Line chart. 60-day rolling correlation between daily returns of gold and S&P 500, from 2000 to present. Visible: correlation oscillates between -0.4 (strong negative, gold as hedge) and +0.4 (gold and equities moving together). The positive periods cluster around liquidity events. Annotation marking the 2008, March 2020, and August 2024 positive-correlation spikes.
On goldintel today
The dashboard's Market Drivers panel includes VIX. This is the most important sentiment thermometer for gold's safe-haven layer. The session briefs explicitly read VIX in their confluence scoring.
What the dashboard does not currently surface is funding stress — TED spread, FRA-OIS, dollar swap line drawdowns, cross-currency basis. These are the variables that distinguish slow risk-off from fast liquidity. Adding a panel for funding stress would let the dashboard automatically flag the regime distinction this chapter describes.
Until then: when VIX spikes above 30, ask yourself whether funding markets are also under stress. The FRED series for TED spread is free and updates daily. A quick check takes 30 seconds and prevents a 2008-style mistake.
Common mistakes
- "Stress = gold up." Conditional. Stress with stable funding markets = gold up. Stress with funding crisis = gold down first, then up.
- "VIX above 30 always means buy gold." Sometimes correct, sometimes catastrophic. If FRA-OIS or TED is also spiking, sell-first-buy-later is the right play.
- "The 2008 gold fall was anti-gold." It wasn't. It was forced selling driven by margin and funding. The fundamental case for gold (Fed easing into ZIRP, QE coming) was strengthening throughout.
- "This is the new permanent regime." Each crisis is different but the underlying pattern of liquidity-first-then-fundamentals has held across multiple cycles. Expect the same shape next time.
Key takeaway
Gold is a safe haven in slow risk-off. Gold is a source of liquidity in fast liquidity crises. The difference is funding stress. Check it before assuming "stress = gold up."
Further reading:
- Adam Tooze, Crashed: How a Decade of Financial Crises Changed the World — for the funding-stress mechanics of 2008.
- BIS, Quarterly Review, March 2020 special section on cross-asset liquidity during COVID.
- For real-time funding indicators: FRED series for TED spread, FRA-OIS spread, and the New York Fed's reverse repo data.
- Andy Lo, Adaptive Markets — theoretical framework for why correlations shift in stress.
Quick reference
| Regime | Gold behavior | SPX | VIX | DXY |
|---|---|---|---|---|
| Risk-on | Slow grind up/sideways | Up | Low (<15) | Mixed |
| Risk-off (mild) | Bid, often outperforms | Down 2–5% | 20–30 | Up |
| Acute risk-off | Spikes, then liquidates | Down 5–15% | 40+ | Up sharp |
| Recovery | Lags initially | Sharp rebound | Falling | Falling |