Chapter 28 — The events that matter: NFP, CPI, FOMC, ECB
Most days in the gold market, there is no scheduled event of consequence. The price moves on macro drift, on news flow, on technical structure. A few times a month, that changes. A specific economic release or central bank decision is scheduled to hit at a known time, the market knows it is coming, and the price reaction in the minutes around the release is sharp, large, and qualitatively different from the rest of the trading day.
These scheduled events are the trader's gift and trap. A gift because the volatility around them is predictable in timing if not in direction — you know exactly when the move will happen. A trap because the moves are fast, mean-reverting in the first few minutes, and stop-hunting in their character. Most retail traders who try to "trade the event" lose money. The traders who profit from events do so by positioning around them, not by trying to react to them.
This chapter is about which events matter for gold, how they typically play out, and how to position around them rather than react to them.
The events that move gold most
In rough order of typical impact:
-
FOMC (Federal Open Market Committee) decisions. Every six weeks, on Wednesday at 2:00 PM Eastern. Statement plus press conference. The dot plot four times a year (March, June, September, December). The single most impactful event for gold most years.
-
US CPI (Consumer Price Index) release. Monthly, second Tuesday or Wednesday of the month, at 8:30 AM Eastern. The most market-moving single data release in the gold space.
-
US Non-Farm Payrolls (NFP). Monthly, first Friday at 8:30 AM Eastern. Less directly relevant to gold than CPI but still significant, particularly when Fed policy is data-dependent.
-
ECB (European Central Bank) decisions. Every six weeks, on Thursday at 13:45 CET (rate decision) and 14:30 CET (press conference). Less impactful than FOMC for gold but increasingly important as the euro is the largest non-dollar reserve currency.
-
PCE (Personal Consumption Expenditures) release. Monthly, end of month at 8:30 AM Eastern. The Fed's preferred inflation measure. Important but typically priced in by the prior CPI release.
-
Other Fed events: Jackson Hole (late August), Fed minutes (three weeks after each FOMC), Powell congressional testimony (twice yearly).
-
BOJ (Bank of Japan) decisions. Eight times yearly. Mostly matters via the yen channel discussed in Chapter 17.
-
Major geopolitical events when scheduled (G7 summits, peace negotiations, OPEC meetings).
A trader watching only the first four items on this list captures over 80% of scheduled-event impact for gold.
Anatomy of an event reaction
A typical CPI release plays out, on the 1-minute chart, in roughly this sequence:
- 8:29:55 - 8:30:00: Volume drops as algorithmic systems pause for the data. Spreads widen slightly. A 5-second hush.
- 8:30:00 - 8:30:10: Data hits the wire. Algorithmic systems execute pre-programmed trades based on the surprise (data vs expectation). Price moves $10-30 in the direction of the surprise within 10 seconds.
- 8:30:10 - 8:31:00: Discretionary traders react. The move extends or partially reverses based on the second-order interpretation (how does this affect Fed expectations?).
- 8:31 - 8:35: Initial volatility settles. A 60-90 second period where the market digests the reaction. Often a partial reversal occurs as algorithms unwind initial positions and discretionary traders take profits.
- 8:35 - 9:00: Continued processing. The "real" price reaction emerges, which may be a continuation of the initial move, a complete reversal, or a stabilization at a new level.
- 9:00 - end of day: The day's broader trading pattern. The release has been digested; subsequent moves reflect the new information plus the rest of the day's drivers.
This pattern repeats with variations across most scheduled releases. The first 30 seconds are dominated by algorithms. The next 5 minutes are dominated by short-term traders. After that, the broader market integrates the information.
How to position around events
Three workable approaches:
Approach A — close out before the event. If you have an open position and your thesis is sensitive to the event outcome, exit before the release. Re-enter after the dust settles based on the new information. Cost: some opportunity if the event resolves in your favor. Benefit: protection from getting stopped out by adverse data.
Approach B — hold through with reduced size. Keep the position but reduce size to 25-50% of normal so that an adverse reaction is survivable. Re-add size after the volatility settles and the direction is clearer.
Approach C — set entry orders, not market orders. If you want to trade the event reaction, do not place market orders into the volatility. Instead, place limit orders at levels you would want to enter if reached. Algorithm-driven extension and reversion often touches these levels and fills you at favorable prices. Manual click-trading into the post-release minute is one of the worst-execution trading practices.
What does not work:
The "trade the headline" approach. Watching the data print and clicking buy or sell within 5 seconds. Algorithms have already moved the price. By the time a human executes, you are buying the top or selling the bottom of the initial move. This is the single most common money-losing event-trading behavior.
The "front-run the consensus" approach. Trying to predict the data release in the hours before and positioning accordingly. Sometimes works, but expected value is negative when sized properly because the consensus is usually right within a small range.
A worked example: a CPI day
The setup: Wednesday, 8:25 AM Eastern. CPI release in 5 minutes. Consensus is 3.2% headline, 3.4% core. Market is positioned long gold, expecting an in-line print to maintain Fed cut expectations.
You have a long position in gold from $2,700. Daily ATR is $40. Stop is at $2,670 (0.75 ATR below entry).
Approach A. Close at 8:25 at market ($2,712, say). Avoid the event volatility. Wait for the dust to settle and re-evaluate at 8:35 or later.
Approach B. Reduce size to half. Original 1% risk position becomes 0.5% risk. Stop stays at $2,670. If event goes badly, you lose 0.5% instead of 1%. If it goes well, you give up some upside, but you can re-add after.
Approach C. Hold full size, but place a take-profit order at $2,750 (a strong upside level if the event is gold-bullish) and a stop order at $2,670. Let the orders execute the volatility for you.
The wrong approach: stare at the screen, watch the print hit, click buy at $2,725 when gold spikes (after a hot inflation print), get stopped out at $2,670 when the rally reverses on a hawkish Fed reaction interpretation 30 minutes later.
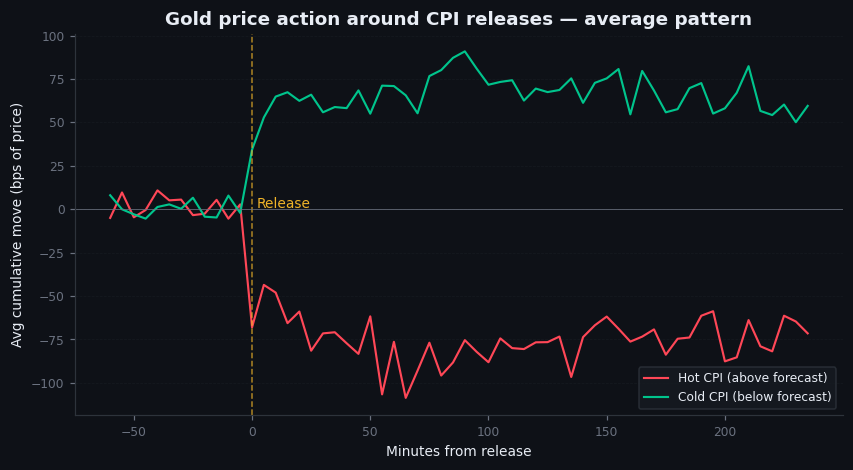
Figure 28.1 — Gold price action around CPI releases, average pattern
Time-series chart. Average gold price movement in the 60 minutes around CPI releases, indexed to the release moment (T=0). Visible: sharp move in the first 60 seconds (algorithmic response), partial reversal at T+2 to T+5 minutes (short-term mean reversion), then directional resolution from T+10 to T+60 minutes. Pattern aggregated across 24+ CPI releases over 2022-2025.
Illustrative — illustrative average pattern.
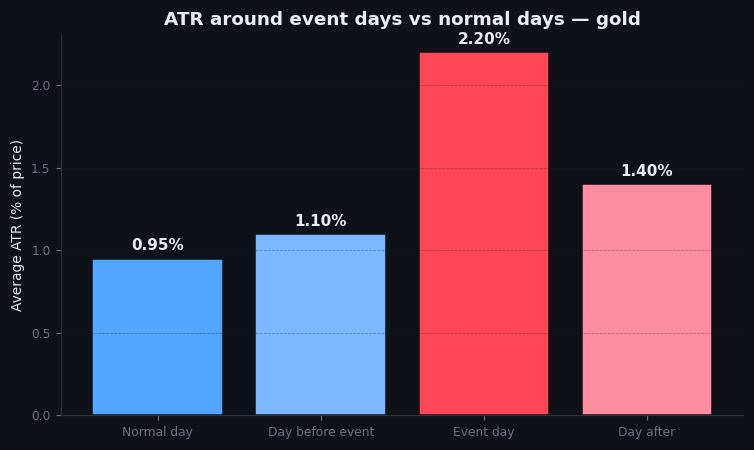
Figure 28.2 — ATR around event days vs normal days
Bar chart. Average daily ATR for gold on FOMC, CPI, NFP days vs average ATR on non-event days. Visible: event days have 30-60% higher ATR. The volatility is real and consistent.
Illustrative — illustrative comparison, calibrated to typical event-day ATR.
On goldintel today
The dashboard's Event Countdown panel surfaces the next major scheduled event with a countdown timer. The news feed picks up release headlines as they cross the wire and runs them through the LLM scoring. The session briefs occasionally reference upcoming events in their analysis.
What the dashboard does not surface in detail: consensus expectations, historical reaction patterns by event type, gold's specific responsiveness to each event. These are useful inputs for event-positioning decisions and would be valuable additions.
For now, the workflow is: see the event on the dashboard, look up consensus expectations on a forex calendar (forexfactory.com, investing.com), decide on approach A/B/C, and execute before the release rather than during it.
Common mistakes
- "I'll just trade the event." The event reaction is the worst time for human discretionary trading. Algorithms own those 60 seconds.
- "Hold through events for the full move." Sometimes works, sometimes catastrophic. The full move is often a round-trip — sharp move, partial reversal, then directional resolution. Holding through means accepting the full volatility.
- "Tighten stops before events." Wrong direction. The event creates more volatility, not less. Tight stops in event windows get hit by noise. If risk-managing around events, do it by reducing size, not tightening stops.
- "NFP doesn't matter for gold." It matters less than CPI but it matters. NFP drives Fed expectations, which drive real yields, which drive gold. The chain is two steps deeper than CPI's one-step impact, but it is real.
Key takeaway
Scheduled events produce predictable volatility windows. Position around them with approach A (exit), B (reduce), or C (limit orders), not by reactive clicking. The trader who plans for events outperforms the trader who reacts to them.
Further reading:
- ForexFactory and Investing.com economic calendars — free, comprehensive, both update consensus expectations in the days leading up to releases.
- Bureau of Labor Statistics, CPI methodology. Worth reading once.
- Federal Reserve Bank of New York, Liberty Street Economics blog — frequently publishes analysis of how markets react to specific releases.
- For execution practices around events: any of the major sell-side execution research notes from Goldman, Morgan Stanley, or Citi — written for institutional execution traders but the principles apply.
Quick reference
| Event | Cadence | Gold-if-hot bias | Typical move (XAUUSD) |
|---|---|---|---|
| US CPI | Monthly | Bearish | $20–$60 intraday |
| US Core PCE | Monthly | Bearish | $15–$40 |
| US PPI | Monthly | Bearish (smaller) | $10–$25 |
| US NFP | Monthly (1st Fri) | Bearish | $20–$50 |
| FOMC decision | 8/year | Hawkish: bearish | $30–$80 |
| FOMC press conf | Same day | Powell tone-dependent | $20–$60 |
| US 10Y auction | Monthly | Strong demand: bullish | $5–$15 |
| China PMI | Monthly | Hot: mildly bullish | $5–$15 |